Public Status Page

Xitoring Launches Public Status Page

Leading provider of IT monitoring solutions, Xitoring, is pleased to announce the release of its brand-new solution for public status pages. Businesses can use the platform to build their own public status pages that update clients on the status of their goods and services in real time, including any known problems or outages.

The platform allows businesses to give their consumers real-time updates, notifications, and historical data. It is simple to use, configurable, and can be linked into a company’s own website. This enhances communication and transparency, assisting businesses in earning the trust of their clients by demonstrating their openness regarding any problems that might harm their service.

“When it comes to IT services, we at Xitoring recognize the value of openness and communication,” stated Xitoring Co-Founder Saman Soltani. “Our new tool enables businesses to design their own status pages, offering real-time information to their consumers regarding the operation of their services and any disruptions that may occur, assisting them in improving the overall customer experience.”

The public status feature is available for businesses of all sizes and can be accessed through Xitoring’s website. Businesses may start creating their own status pages after signing up for a free trial.

Xitoring is committed to providing businesses with the tools they need to improve communication and transparency with their customers. The public status page platform is the latest addition to the company’s offerings, and it is expected to help businesses to improve the performance and availability of their IT infrastructure.

Xitoring was introduced in 2021 with the goal of revolutionizing the server monitoring industry. The company’s automated platform is the latest addition to its offerings and is aimed at businesses that are tired of traditional ways of server monitoring and are looking for more efficient and automated solutions.

Sign up here to start creating your own status page within 5 minutes!

Read more on Public Status Page


Xitoring Launches new User Interface and Dashboard!

It’s very thrilling to announce that we have re-coded our whole user interface with the latest technologies using React v18 to improve the user experience. Our frontend engineers and product team is working very hard for daily builds, adding features, and applying bug fixes.

The mobile experience is improved significantly compared to the latest version, also we now have Dark mode!

New drag-and-dropable widgets on the dashboard let you have a glance at your Servers, Uptime Checks, Incidents, or account-related stuff like login sessions or billing.

Dark mode:

Light mode:

Xitoring Dashboard light mode


Stay tuned, we have plenty of good news to be announced shortly!

We are always reachable at [email protected] if you have any questions or feedback.

Windows Server Monitoring

Xitoring now supports Windows Server monitoring!

We are thrilled to announce that Xitoring now offers Windows Server monitoring! It has been always a significant feature request from our customers to have this feature, and now we are very proud to have your requirement fulfilled =)

Our first product was Xigent v1 only supports a few Linux-based operating systems, then we went ahead developing a new version called v2 for Linux which now supports the major version of distributions. According to public statistics, Linux servers have about 15% of the market share and the rest belongs to Windows Servers which is about %73 of the market share. Our product will be very beneficial for Windows Server users we believe it has made the whole process much easier for them to Install, set up, and maintain. Our near competitors for Windows Server monitoring offers much more complex solution with higher rates. The belief and mindset behind our products are simplicity and ease of use, although the data we collect from servers are comprehensive. Your server will be connected to your nearest Xitoring node for the least network latency, and the date you sent, is fully analyzed and visualized.

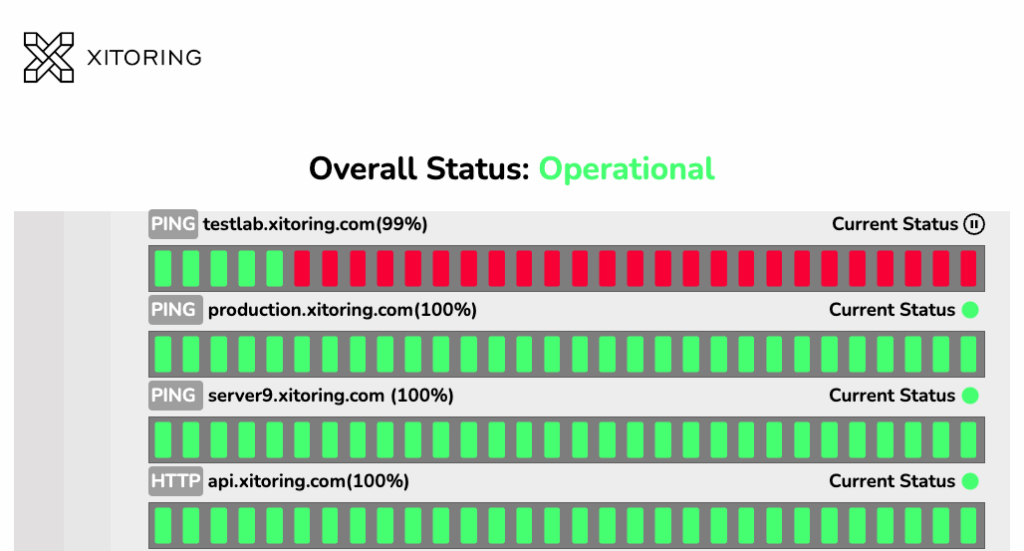
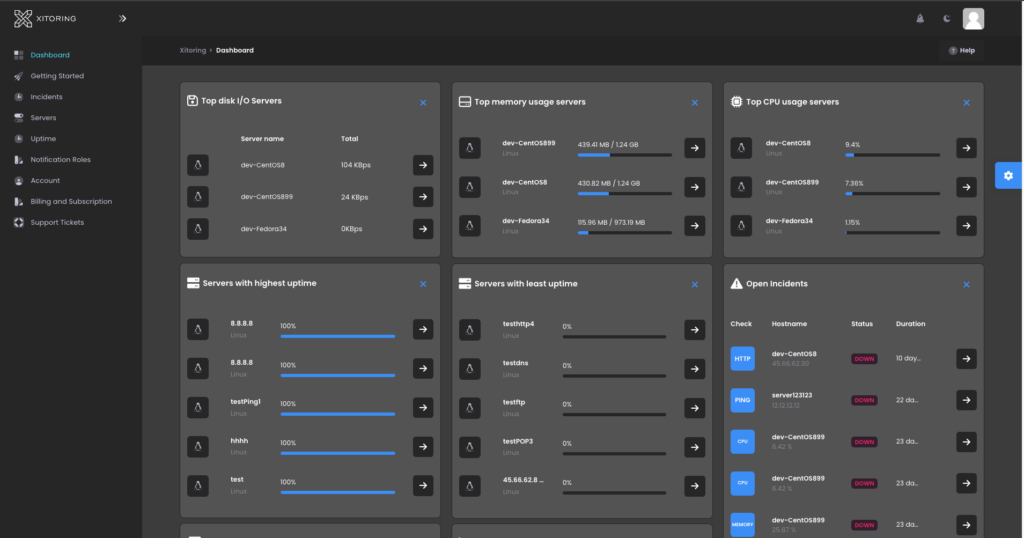
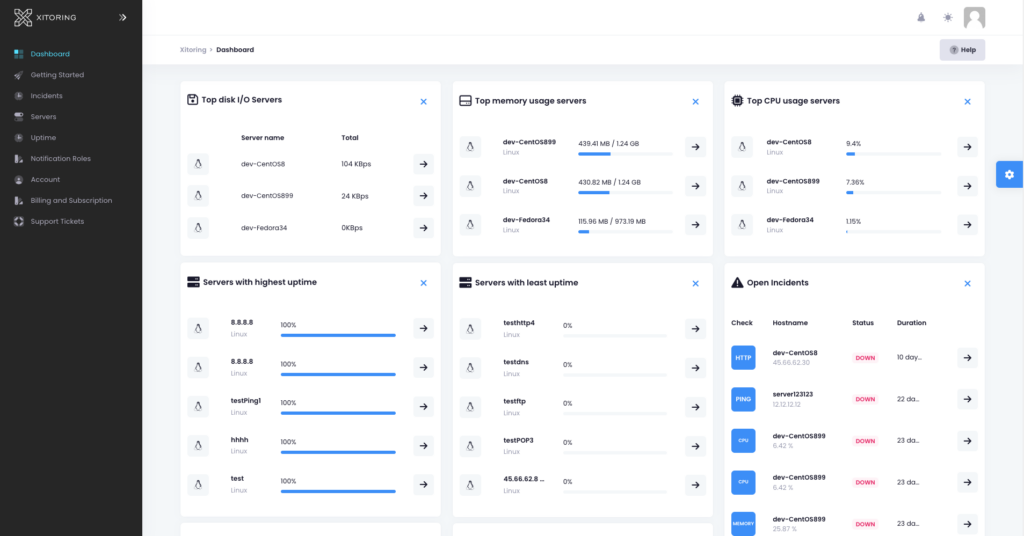
We provide live statistics for Windows Server and also useful historical graphs for each component including CPU usage, Top Processes, Memory Usage, Disk usage, Disk IO, Network statistics, Netstat data, and much more!

The following versions of Windows Server are officially supported:

  • Windows Server 2012
  • Windows Server 2012 R2
  • Windows Server 2016
  • Windows Server 2019
  • Windows Server 2022

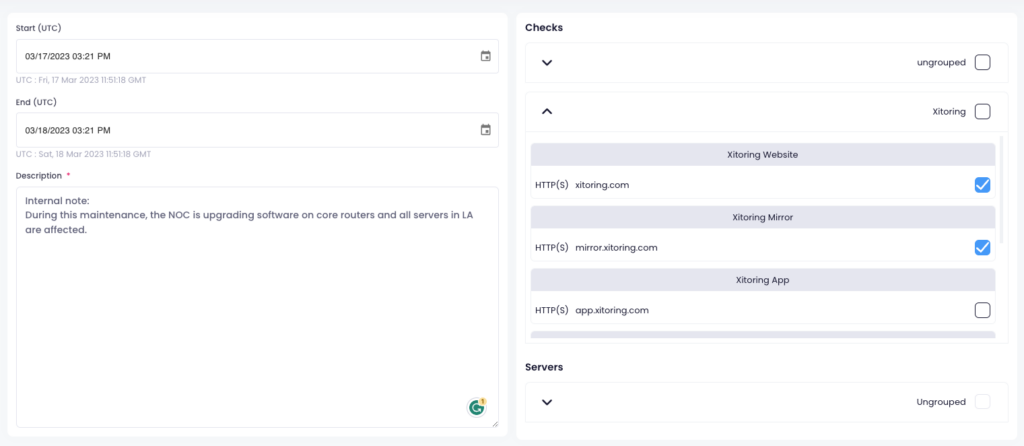
Right after your installation of Xitogent on your Windows Server, you will receive an email indicating your Server is successfully registered and added to monitoring. we automatically and optionally detect running services on your public IP address and create checks and triggers for them. supported check types at the moment are HTTP, HTTPS, DNS, FTP, POP3, IMAP, SMTP, PING, and a few more.

All Xitoring users can benefit from a free plan to monitor up to 5 servers at no cost! You can read the Xitoring Windows manual for more information.

Registration and adding a Windows server is exactly like the previous Linux installation, you need only to copy a command, paste it into your PowerShell, and the rest is done automatically.

You can always contact our support team if you need any help installing Windows Server Xitogent.

Read more about Windows Server monitoring solutions.

A digital illustration of a laptop screen displaying bar graphs, a paper with data charts, a magnifying glass, and various analytical elements, with the text "Optimize server performance with the right metrics and proactive monitoring

How metric monitoring increases server uptime?

In today’s world, where experience is everything and users look more at the digital experience while deriving satisfaction, server infrastructure performance is an important stake in determining application success. There, users do ask for speed, reliability, and consistency-and any slack regarding these could amount to dissatisfaction, lost revenue, or even damage to your brand’s reputation. While one may argue that the unsung heroes are the servers, driving everything from websites and mobile apps to complex enterprise systems, this requires a lot more than just setting up. To keep them running well, constant attention and watching out for them with strategic optimization become operable. This article examines the key metrics that measure server performance and provides actionable tips for improvement and maintains why vigilance is so important in ensuring a high-performing digital ecosystem.

(more…)

A digital illustration of an IT professional analyzing monitoring dashboards on a large screen with graphs, charts, and performance metrics, emphasizing IT monitoring strategies.

Agent-less vs Agent-based Monitoring

In today’s digital world, IT infrastructure reliability and performance are becoming critical to business success. Monitoring, in effect, acts as the backbone of such efforts in enabling organizations to detect issues at an early stage, optimizing resource utilization, and minimizing downtime. However, finding the right way to monitor may be a challenge as modern IT environments are growing more complex. There are two major approaches mainly: agent-based monitoring and agent-less monitoring; each with various advantages and challenges. Understand the difference; understand the strength, the limitation, and thus make an educated choice. This blog compares side-by-side two different approaches, presenting Xitoring, which offers combined strengths from both for the comprehensive, efficient, and scalable monitoring of infrastructure.

What is Agent-less Monitoring?

Agent-less monitoring refers to the process of monitoring and data collection from servers, network devices, and other IT components without the need for software agents on the monitored systems. It would, therefore, rely on other external mechanisms to gather information. This approach thus becomes highly useful in an environment where deploying agents is either not practical or highly undesirable. There are generally two ways in which agent-less monitoring is done:

(more…)

Illustration of server uptime monitoring with IT professionals working on servers and performance analytics, emphasizing 24/7 monitoring to prevent downtime and ensure business continuity.

Server monitoring vs Uptime monitoring

What is Server Uptime?

The current uptime of a server is the time elapsed since its last reboot. Years, months, days, hours, minutes, and seconds express uptime. Uptime starts at 0 (zero) every time the server starts up again, and it keeps going up as long as the server is working.

Why is Uptime Monitoring Important?

Monitoring is standard in the IT industry because it allows you to maintain the ideal state of the company’s servers. The server performance monitoring procedure is pretty straightforward; it routinely collects server data and analyzes it in real-time or retrospectively. This enables us to guarantee that the servers run properly, delivering their intended purpose.
You may monitor nearly everything, including processor performance control, memory consumption, network, and disk space bandwidth, and server-related issues. However, understanding how to monitor a server is insufficient. It is essential to comprehend why it is such an integral component of its security. The purpose of monitoring is to provide information on failures and performance issues and to anticipate and prevent problems. In practice, this implies that faults or anomalies are discovered so quickly that the entire organization’s service, application, or operation is not halted. As a result, the company’s server infrastructure functions properly and reliably, and the company does not incur losses due to lengthy system outages.

(more…)

Xitogent v2 released

Hello!

We are very pleased to announce a new major version of Xitogent which has lots of improvements. Xitogent is now served on our private repositories for Debian and Redhat distributions and can be easily installed and upgraded on any Linux server. It’s written in Go Programming Language and it’s super-fast, has a smaller footprint, and provides wide OS support.

Xitogent v1 was our first product for agent-based monitoring solution on Linux and there has been a lot of issues and bugs which has been addressed over the time, but it has been months that it didn’t get any new patches and version because we have been working hard to provide a new major and stable version for enterprise usage.

Here are a few lists of features and changes on V2:

  • Improved service manager
  • Improved daemon
  • Log rotation handling
  • Netstat Statistics Support
  • Docker Statistics Support
  • Ability to pause or unpause sending data from Xitogent cli
  • Ability to trigger check discovery from Xitogent cli
  • Disk I/O calculation is now more accurate
  • Network statistics are now more accurate
  • New installer which supports GPG key for more security
  • Fix bugs parsing config file in some cases
  • and many small bug fixes!

All users using Xitogent v1 can update to v2 using one command, if you need help upgrading to v2 please contact us at [email protected] any time.

We will stop support for Xitogent v1 by July 31st, please make sure to upgrade as soon as possible.

You can read more about Xitogent here: https://xitoring.com/docs/

About Xitogent

Xitogent runs as a service on your server and automatically sends your server statistics continuously to your nearest Xitoring’s Server and we use the data to generate graphs or find out if something’s wrong on your server (e.g. we’ll automatically notify you if your CPU or memory usage is above normal). It runs on a recurring interval and sends statistics to the nearest probe node, we’ll use the data to make sure everything is fine on your server and then use it to make useful graphs (Server Load, CPU Usage, Memory Usage, Disk IO, and Disk Usage).

If you’re new to Xitoring, you can register in a minute and start monitoring 5 Linux servers at no cost forever!

Stay tuned! more features are coming!

Xitoring now supports Rocky Linux!

We are happy to announce that Xitogent is now compatible with Rocky Linux 8. Xitoring offers free server monitoring (up to 5 servers) for Rocky Linux users.

Rocky Linux aims to function as a downstream build as CentOS had done previously, building releases after they have been added by the upstream vendor, not before. Its name was chosen as a tribute to early CentOS co-founder Rocky McGaugh!

The CentOS project announced a shift in strategy for CentOS. Whereas previously CentOS existed as a downstream build of its upstream vendor (it receives patches and updates after the upstream vendor does), it will be shifting to an upstream build (testing patches and updates before inclusion in the upstream vendor). Additionally, support for CentOS Linux 8 has been cut short, from December 31, 2029, to December 31, 2021.

By Installing Xitogent on your Rocky Linux server you can easily gather all server statistics and data without hassle, and Xitoring does the most for you. Including service discovery, creating initial checks, generating graphs, configuring initial triggers, etc.

Xitogent runs as a service on your server and automatically send your server statistics continuously to your nearest Xitoring’s Server and we use the data to generate graphs or find out if something’s wrong on your server (e.g. we’ll automatically notify you if your CPU or memory usage is above normal). It runs on a recurring interval and sends statistics to the nearest probe node, we’ll use the data to make sure everything is fine on your server and then use it to make useful graphs (Server Load, CPU Usage, Memory Usage, Disk IO, and Disk Usage).

If you’re new to Xitoring, you can register in a minute and start monitoring 5 Linux servers at no cost forever!


About Xitogent

Xitogent is a python-based and open-source application that is the core of our innovation, Xitogent can collect data from your servers in an efficient way. it’s very lightweight, easy to install, and configurable.
We are always developing Xitogent to improve and add features, At this time Xitogent has been tested on all major Linux Distros which are the most used OSes in the market.
You can read more about Xitogent here or on Github.

About Rocky Linux OS

Rocky Linux is a community enterprise operating system designed to be 100% bug-for-bug compatible with America’s top enterprise Linux distribution now that its downstream partner has shifted direction. It is under intensive development by the community. Rocky Linux is led by Gregory Kurtzer, founder of the CentOS project. Contributors are asked to reach out using the communication options offered on this site.

Xitoring now supports AlmaLinux!

We’re proud to announce that our Agent for Server Monitoring “Xitogent” is now fully supporting AlmaLinux 8.

AlmaLinux is one of several Linux distributions jostling for position as “the new CentOS” in the wake of Red Hat’s December 2020 deprecation of its own free-as-in-beer Red Hat Enterprise Linux clone distribution.

By Installing Xitogent on your AlmaLinux server you can easily gather all server statistics and data without hassle, and Xitoring does the most for you. Including service discovery, creating initial checks, generating graphs, configuring initial triggers, etc.

Xitogent runs as a service on your server and automatically send your server statistics continuously to your nearest Xitoring’s Server and we use the data to generate graphs or find out if something’s wrong on your server (e.g. we’ll automatically notify you if your CPU or memory usage is above normal). It runs on a recurring interval and sends statistics to the nearest probe node, we’ll use the data to make sure everything is fine on your server and then use it to make useful graphs (Server Load, CPU Usage, Memory Usage, Disk IO, and Disk Usage).

If you’re new to Xitoring, you can register in a minute and start monitoring 5 Linux servers at no cost forever!

About Xitogent

Xitogent is a python-based and open-source application that is the core of our innovation, Xitogent can collect data from your servers in an efficient way. it’s very lightweight, easy to install, and configurable.
We are always developing Xitogent to improve and add features, At this time Xitogent has been tested on all major Linux Distros which are the most used OSes in the market.
You can read more about Xitogent here or on Github.

About AlmaLinux OS

AlmaLinux, an open-source community-driven project hosted by a non-profit foundation, intends to fill the gap left by the demise of the CentOS stable release. AlmaLinux is an enterprise-grade server OS, initially built by the team at CloudLinux, that is owned and governed by the community. CloudLinux has committed a $1 million dollars annual endowment to support the project. AlmaLinux OS is a 1:1 binary compatible fork of RHEL 8 with plans to support future RHEL releases by updating AlmaLinux OS.


Xitoring integrated with Slack!

Xitoring is now integrated with Slack to keep the entire team in sync. Slack provides a group chat platform for agile teams, making it easy to keep distributed groups informed and productive through real-time sharing of information and integration with third-party systems. You can now automatically send all incidents and warnings from Xitoring to Slack through this integration.

This integration will send the same information that you see in Xitoring incidents and receive on e-mail or SMS. The following types of information will be sent from Xitoring to Slack in real-time.

  • Incidents on Servers (e.g. CPU usage is high)
  • Incidents on Checks (e.g. HTTP is down)


This integration is available on both Free and Paid plans!


Configuration

You need a Xitoring account and a Slack account to create this integration. Configure the integration in Slack first.

Create Webhook on Slack

In Slack, go to the integrations section of the account configuration.

  1. Create a new Incoming WebHooks integration.
  2. Choose or create a channel for the Xitoring notifications to be sent to. (e.g. #Incidents)
  3. Copy the value of the Your Unique Webhook URL field.

Create the integration in Xitoring

  1. Navigate to the ‘Notification Roles’ page and modify your desired item.
  2. Enter the URL from step 4 above in the Webhook URL field.
  3. Click the Test button. After a short delay, you should see a message appear in your Slack client in the channel you selected.
  4. Save changes.

Receiving Incidents on Slack

After proper configuration, you will receive incidents from Xitoring for both Servers and Checks on your desired Slack channel for the entire team.


You can always contact our support team if you need any help enabling the Slack integrations.

Stay tuned! more integrations are coming soon.