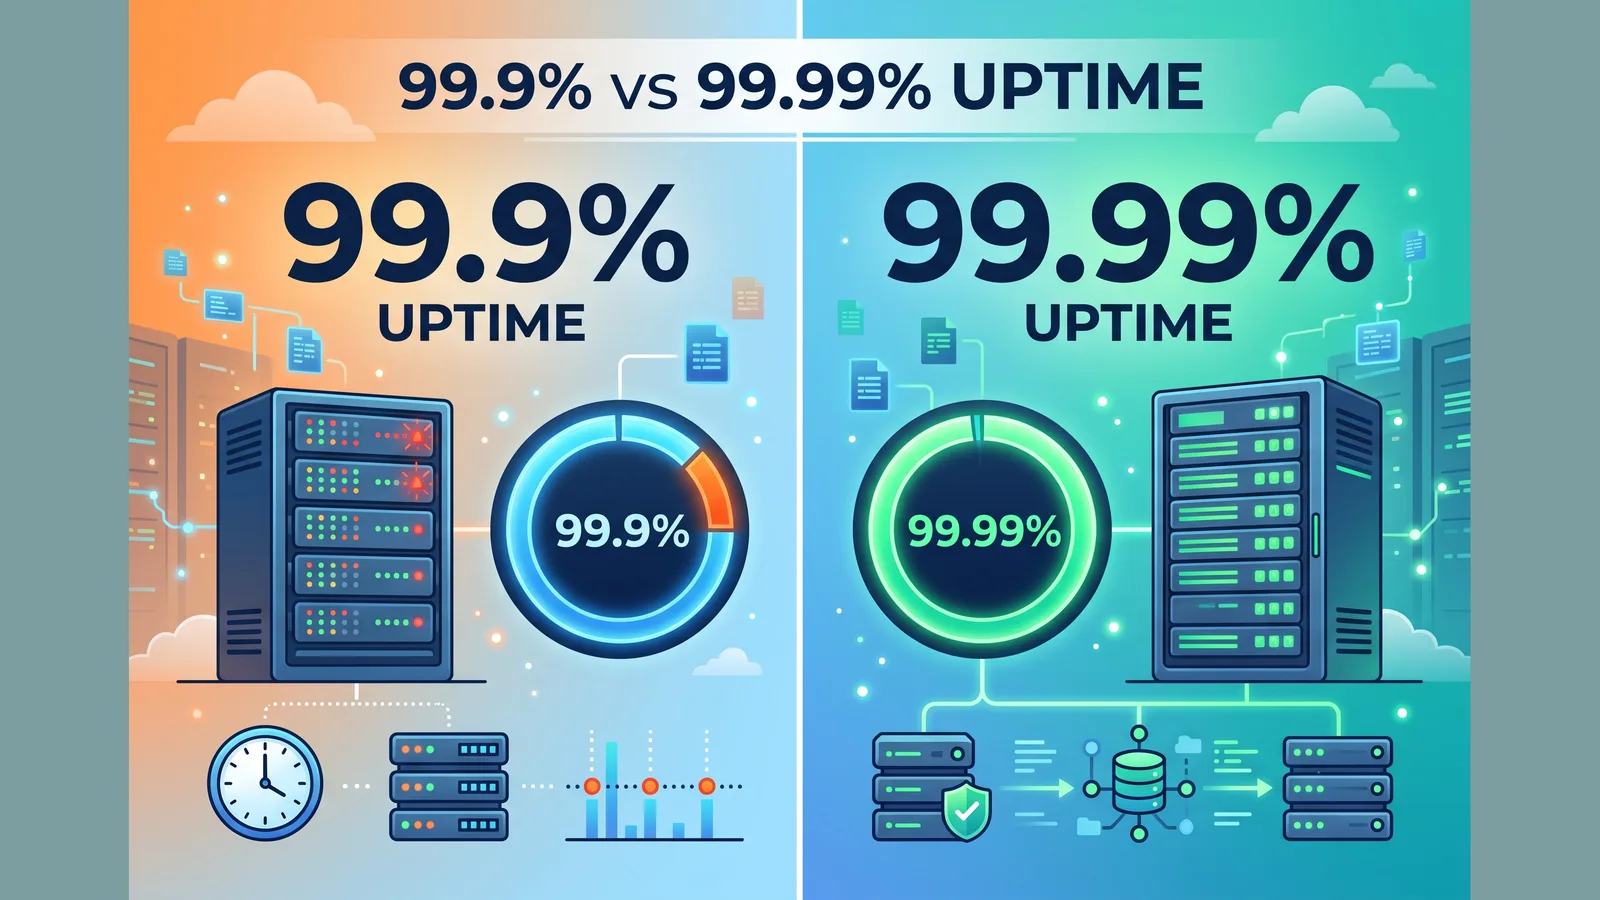
"We're targeting four nines" sounds like a decision. It usually isn't — because the person saying it rarely knows that the difference between 99.9% and 99.99% is the difference between 43 minutes of allowed downtime per month and 4 minutes. One of those is survivable with a human noticing a page and rebooting something. The other requires automated failover, because 4 minutes is less time than it takes to wake up.
This is the reference table, plus the parts of the calculation that trip teams up.
The downtime table
Allowed downtime at each availability level, by measurement window. Bases: year = 365 days, quarter = 91.25 days, month = 30 days, week = 7 days. Worth stating explicitly, because 12 × 30 ≠ 365 — the columns are each exact for their own window, not derivable from one another, and a vendor quoting a suspiciously generous monthly figure is often using a 30.44-day average month.
| Uptime | Per year | Per quarter | Per month (30d) | Per week | Per day |
|---|---|---|---|---|---|
| 99% ("two nines") | 3d 15h 36m | 21h 54m | 7h 12m | 1h 40m 48s | 14m 24s |
| 99.5% | 1d 19h 48m | 10h 57m | 3h 36m | 50m 24s | 7m 12s |
| 99.9% ("three nines") | 8h 45m 36s | 2h 11m 24s | 43m 12s | 10m 5s | 1m 26s |
| 99.95% | 4h 22m 48s | 1h 5m 42s | 21m 36s | 5m 2s | 43s |
| 99.99% ("four nines") | 52m 34s | 13m 8s | 4m 19s | 1m 0s | 8.6s |
| 99.999% ("five nines") | 5m 15s | 1m 19s | 26s | 6s | 0.9s |
Two things jump out of that table.
Each nine costs 10× the previous one. Not in engineering effort — in permitted failure. Going from 99.9% to 99.99% doesn't make your job 10% harder; it cuts your monthly margin for error from 43 minutes to 4. Every layer of your stack that can fail for five minutes has just become an SLO violation on its own.
Below four nines, a human can be in the loop. At and above it, they can't. A 99.9% monthly target survives one 40-minute incident where someone gets paged, logs in, and fixes it. A 99.99% target does not survive any incident that requires a human to read an alert first. Detection, decision, and remediation all have to be automatic. That's an architecture decision disguised as a percentage.
How uptime percentage is calculated
Two common formulas, and they don't always agree.
Time-based (what most uptime monitoring and SLAs use):
uptime % = ((total time − downtime) / total time) × 100
Request-based (what SRE-style availability SLOs use):
uptime % = (successful requests / total valid requests) × 100
The gap between them matters. Time-based treats a 10-minute outage at 4am the same as a 10-minute outage at peak traffic. Request-based weights the peak outage far more heavily — which is usually a truer reflection of customer impact, and usually a worse-looking number.
Neither is wrong. But an SLA written against one and measured with the other is a dispute waiting to happen, so state the method in the agreement.
The check-interval floor
Here's the gotcha nobody mentions: your check interval sets the resolution of your uptime number.
If you probe every 5 minutes, the smallest outage you can detect is roughly 5 minutes long, and a failed check conventionally marks the whole interval as down. Which means a single failed check is 5 minutes of recorded downtime. Against a 99.99% monthly target that allows 4m 19s, one failed 5-minute check breaches your SLO — even if the actual outage lasted nine seconds.
The practical implication:
| Target | Maximum sensible check interval |
|---|---|
| 99% | 5 minutes |
| 99.9% | 1–5 minutes |
| 99.95% | 1 minute |
| 99.99% | 30 seconds or faster |
| 99.999% | Not measurable by external probing alone |
That last row is not a limitation of any particular tool. Five nines allows 26 seconds of downtime per month; no probe cadence gives you meaningful confidence at that resolution. Teams claiming five nines are almost always measuring request success rates at the application layer, not synthetic uptime — or they're rounding generously.
30 days vs 31 days vs 365.25
Minor, but it comes up in contract review. A 30-day month gives 43m 12s at 99.9%; a 31-day month gives 44m 38s. Using 365.25 days for the year (accounting for leap years) turns 8h 45m 36s into 8h 45m 58s. None of this changes an engineering decision, but if your SLA says "per calendar month," compute against the actual month rather than a flat 30 — otherwise February works in your favour and March quietly doesn't.
What each tier actually costs to achieve
The percentage is the easy part. Here's roughly what the architecture looks like at each level.
99% — 7 hours/month. A single server, backups, someone who reads email. Fine for internal tools, staging, and hobby projects. Not fine for anything a customer pays for.
99.5% — 3.6 hours/month. Single server with monitoring and a human on call during business hours. This is where most small self-hosted setups genuinely land, whether or not they claim better.
99.9% — 43 minutes/month. The realistic floor for a paid product. Requires: redundant application instances behind a load balancer, a managed or replicated database, 1-minute external uptime checks, and alerting that reaches a human in under two minutes at 3am. Most incidents are survivable because you have 40 minutes of room.
99.95% — 21 minutes/month. Adds multi-AZ deployment, automated instance replacement, database failover that doesn't require a human, and a tested runbook for the top five failure modes. You now need escalation policies rather than a single on-call phone, because a missed page burns most of your monthly budget.
99.99% — 4 minutes/month. Multi-region active/active or hot-standby with automated traffic shifting, health-check-driven failover measured in seconds, no single-region dependencies (including DNS and certificate renewal), and load-shedding rather than hard failure under stress. Deploys must be zero-downtime and instantly revertible. The dominant cost here is not servers, it's the engineering discipline to keep every change from becoming a 4-minute event.
99.999% — 26 seconds/month. Realistically achieved by a handful of infrastructure providers and telecoms, at a cost structure most businesses shouldn't want. If a vendor claims five nines on a marketing page, ask which window and which measurement method. Usually one of the two answers is doing a lot of work.
Where the nines actually leak
Teams optimise the application and then lose the budget somewhere else:
- DNS. A registrar or nameserver problem takes you down globally and your app-level metrics show 100% success, because nothing reaches you. Monitor DNS resolution separately.
- TLS certificate expiry. The most preventable outage in the industry. An expired cert is a total outage for every browser client, and it happens on a schedule you know in advance. SSL monitoring with a 30-day warning eliminates this class entirely.
- Third-party dependencies. Your payment processor, auth provider, or CDN having a bad hour is your outage as far as your customers are concerned. Their nines multiply against yours — two dependencies at 99.9% each put your ceiling near 99.8% before your own code runs.
- Deploys. In a lot of shops, most recorded downtime is self-inflicted and happens on weekday afternoons.
- Cron and background jobs. Not visible to uptime probes at all. A silently failing nightly job doesn't move your availability number and still breaks the product; that's what cronjob monitoring covers.
What number should you actually promise?
Pull your last 6–12 months of measured availability. Take your worst month, not your average. Promise something you beat in that month.
The reason is asymmetry: exceeding your SLA gets you nothing beyond goodwill, while breaching it costs credits, an incident report, and a renewal conversation you didn't want. A 99.9% SLA you consistently beat with real 99.97% performance is a stronger commercial position than a 99.99% SLA you miss twice a year — and if a prospect pushes for more nines, the honest answer ("we've measured 99.97% over the last year; here's the page where you can verify it") converts better than a number you're guessing at.
Then publish the history. Uptime you report on a status page from third-party monitoring data is verifiable; a number in a slide deck isn't.
Related reading
- SLA vs SLO vs SLI: What's the Difference? — how the target you pick here becomes an internal objective and a contractual promise
- Error Budgets Explained — the minutes in this table, treated as a resource you spend
- How to Achieve 99.99% Uptime for Your Website — the architecture work behind the four-nines row
- Understanding Uptime and Downtime — the fundamentals, if you're starting from zero
- Common Causes of Server Downtime (and Fixes) — where the minutes usually go
- Uptime Monitoring (product) — 60-second checks from 15+ global nodes, with the retention you need for monthly reporting
Frequently Asked Questions
How much downtime does 99.9% uptime allow?
43 minutes and 12 seconds per 30-day month, or 8 hours 45 minutes per year. Per week it's about 10 minutes. This is the most commonly committed SLA tier for B2B SaaS because it leaves enough room to survive one moderate incident per month with a human in the response loop.
How much downtime does 99.99% uptime allow?
4 minutes 19 seconds per 30-day month, or 52 minutes 34 seconds per year. That's under 9 seconds per day. Practically, it means no incident can require a human to read an alert before remediation begins — detection and failover both have to be automated.
What's the difference between 99.9% and 99.99% in practice?
A factor of ten in allowed downtime: 43 minutes per month versus 4. The engineering difference is larger than the numeric one, because the extra nine removes the human from the recovery path. Three nines is achievable with redundancy and good alerting; four nines requires automated multi-region failover and zero-downtime deploys.
How is uptime percentage calculated?
Time-based: ((total time − downtime) / total time) × 100. Request-based: (successful requests / total valid requests) × 100. Uptime monitoring tools and most SLAs use the time-based formula; SRE-style availability SLOs typically use the request-based one, which weights outages during peak traffic more heavily. Specify which method your SLA uses, because the two produce different numbers for the same incident.
Does my check interval affect my uptime percentage?
Significantly. A failed check conventionally marks its whole interval as downtime, so 5-minute checks record a 10-second outage as 5 minutes of downtime — enough to breach a 99.99% monthly target on its own. Match the interval to the target: 1 minute for 99.9–99.95%, 30 seconds or faster for 99.99%.
Is 100% uptime possible?
Not over any meaningful period, and no credible vendor commits to it contractually. Certificate renewals, kernel patches, DNS propagation, and upstream provider incidents all guarantee some non-zero downtime. A vendor advertising 100% uptime is either describing a short historical window or excluding enough categories in the fine print to make the claim meaningless.
Do scheduled maintenance windows count against uptime?
Under most SLAs, announced and bounded maintenance is excluded — commonly up to 4 hours per month with 72 hours' notice. Unannounced maintenance counts as downtime. For internal SLOs, many teams count maintenance anyway, on the grounds that customers experience it identically to an outage.