"Is the site up?" is one question. "Is the site fast for users right now?" is different. "When checkout breaks, is it the database, the payment provider, the new feature flag, or the application itself?" is a third. Application monitoring is the discipline that answers the second and third questions — and a meaningful number of teams discover it only after a few painful incidents where the server was healthy, the homepage was returning 200, and customers were still complaining.
Application monitoring is the practice of tracking how your application code behaves at runtime — its request latency, error rates, throughput, and resource saturation — so you can detect and diagnose problems before users feel them. It sits one layer above server monitoring (which watches the host) and one layer above uptime monitoring (which watches the URL from outside).
This is a beginner's guide to what application monitoring is, how it fits alongside server and uptime monitoring, the four signals that matter most, and a pragmatic path from "we have nothing" to "we know what's slow and why" without buying an enterprise APM platform on day one.
It's written for both a non-specialist (someone trying to figure out what to set up for their app) and a sysadmin transitioning from infrastructure-focused monitoring into the application layer.
What is application monitoring, exactly?
Three closely related disciplines often get conflated, and untangling them up front saves a lot of confusion later:
- Uptime monitoring — "is the service responding at all?" External probes hit your endpoints, check the status code and a keyword, alert when something stops responding. Cheap, easy, the table stakes.
- Server monitoring — "is the host healthy?" CPU, memory, disk, network, processes on the machines running your app. Catches the cause of many slowdowns before they manifest as user-visible failures.
- Application monitoring — "is the application doing its job, fast, and correctly?" Per-request latency, error rates, slow queries, dependency failures, custom business metrics. This is what tells you whether your code is healthy, separate from whether the host is healthy.
A typical incident illustrates the difference: a database query gets 10× slower because someone deployed a missing index. Uptime monitoring sees 200s. Server monitoring sees normal CPU. Application monitoring sees the p95 request latency tripling and the slow-query log lighting up. The first two will only catch the problem when latencies cross into timeouts and the site falls over; the third catches it within a minute, before users notice.
Application monitoring is, in short, the layer that watches your code's behavior — not the infrastructure underneath it, and not the URL response from outside.
The four signals that matter
Two influential frameworks — Google's Four Golden Signals (from the SRE book) and Tom Wilkie's RED method — converge on a small set of metrics that cover most of what's worth monitoring at the application layer:
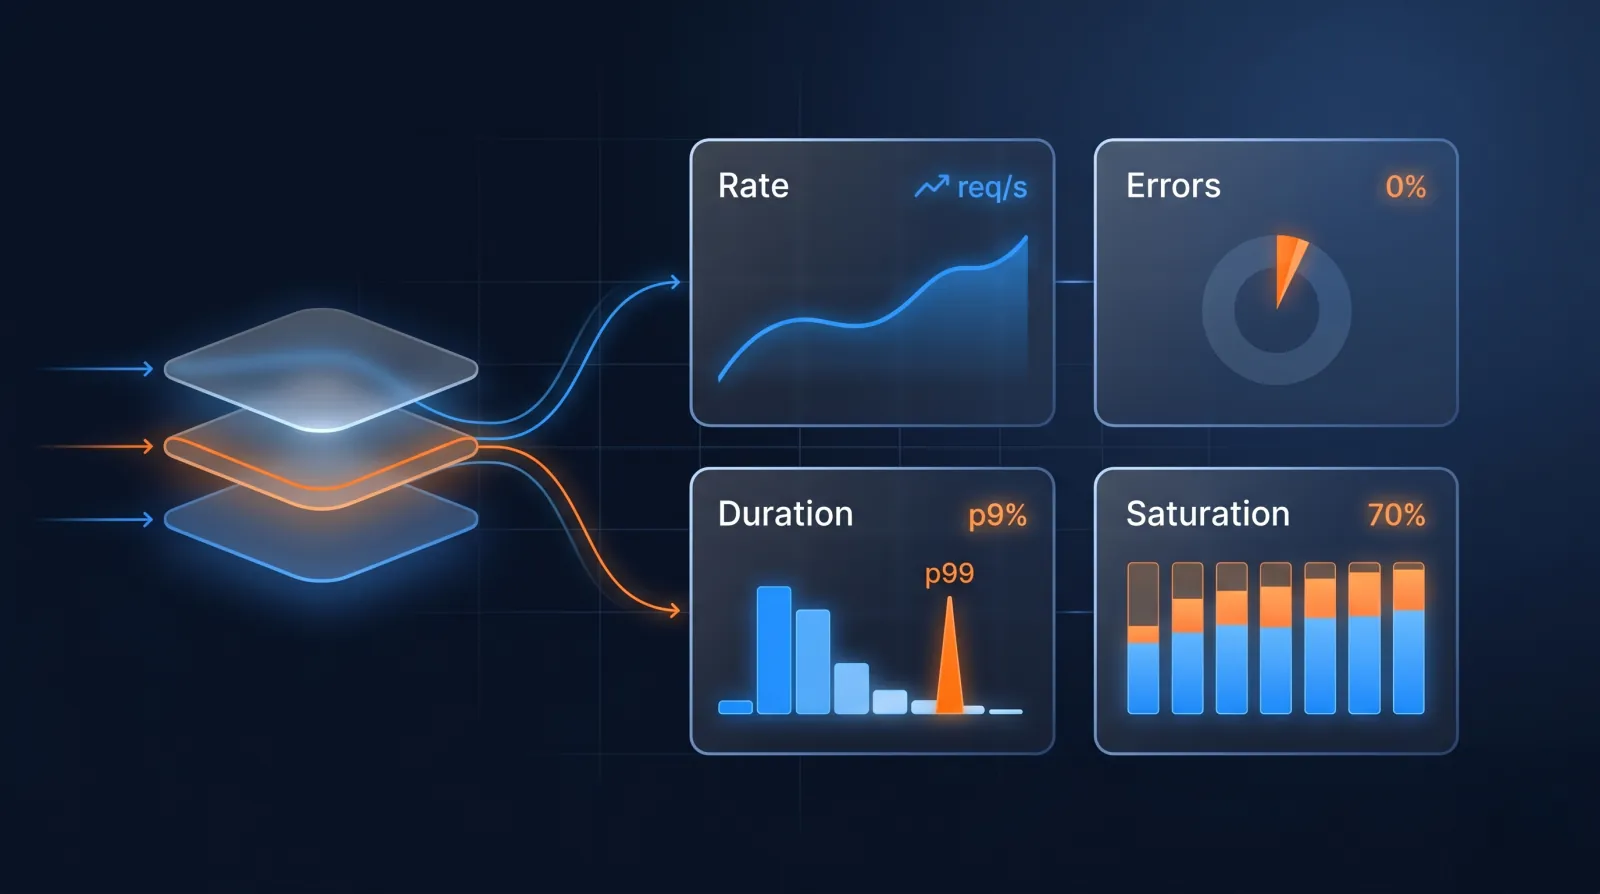
- Latency — how long requests take. Always look at percentiles (p50, p95, p99), never averages. Averages hide outliers; percentiles tell you about the slowest experiences your users are having.
- Traffic / throughput — how many requests the application is handling. Sudden drops mean upstream traffic stopped reaching you (DNS, CDN, load balancer); sudden spikes mean either a real surge or a bug producing retries.
- Errors — the rate of requests returning errors (HTTP 5xx, application exceptions, business-logic failures). The number that matters most is the rate (errors per second or % of requests), not absolute counts.
- Saturation — how full the application's resources are: thread pool, connection pool, queue depth, memory headroom. Saturation is the leading indicator that latency and errors are about to climb.
Brendan Gregg's USE method (Utilisation, Saturation, Errors) predates both and comes at the problem from the systems side — every resource in the machine, not just request paths. USE inspired the request-focused RED method (Rate, Errors, Duration); the two are complementary rather than interchangeable — reach for USE when you're reasoning about resources, RED when you're reasoning about request-driven services.
If you only have time and budget for one application-monitoring investment, instrument these four signals across your most important request paths and you'll catch the majority of incidents before users do.
Application logs are part of the story (but not all of it)
Many teams' first attempt at application monitoring is "we'll just look at logs". This works up to a point and then stops working — for two reasons:
- Logs are expensive to query at scale. Grepping production logs for an error pattern is fine when the volume is megabytes per day. At gigabytes per day across dozens of services, it's slow, costly, and miss-prone.
- Logs answer "what happened" but not "what's the rate". Counting how often a specific error appears in logs over a 5-minute window is technically possible but operationally awkward. Metrics are built for that question; logs are built for context.
The pragmatic split: metrics for alerts and dashboards, logs for context after an alert fires. When the metric "error rate > 1%" trips, you go to the logs to find out which specific errors are firing and why. Both layers are needed; using either alone is harder than necessary.
For the operational side of log handling, see How to tail Docker container logs — the same patterns apply to any container-deployed application.
Synthetic vs real-user monitoring
Two complementary techniques for measuring application performance:
- Synthetic monitoring runs scripted tests against your app from a fixed set of locations on a schedule. The benefit: consistent baseline, runs even when no real users are active, can test paths that don't get organic traffic (admin flows, integration handoffs). The limit: synthetic users don't behave like real ones — they don't have your weirdest user's browser version or worst-network-conditions ISP.
- Real-user monitoring (RUM) instruments the actual frontend (a small JavaScript snippet) and reports timing data from real browsers in the wild. The benefit: it measures what users actually experience, including all the long-tail conditions synthetic monitoring misses. The limit: it only sees real traffic, so paths with no users today are invisible.
Most production setups want both: synthetic for the smoke tests and the SLAs, RUM for the user-experience truth. They answer different questions and shouldn't be substituted for each other.
Xitoring's website monitoring covers the synthetic side — multi-region HTTP/HTTPS checks with response time, status code, keyword, and JSON assertions. Pair with a RUM tool (your APM vendor will offer one; Sentry has a Performance product; Cloudflare offers RUM as part of their analytics) for the real-user view.
Where APM fits
APM (Application Performance Monitoring) is the umbrella term for tools that go beyond metrics into per-request tracing, code-level profiling, and dependency mapping. Datadog APM, New Relic, Dynatrace, AppDynamics, and the open-source equivalents (OpenTelemetry + Jaeger / Tempo) all live in this space.
What an APM gives you that simpler monitoring doesn't:
- Per-request tracing — pick a slow request, see exactly which functions / database queries / external API calls it spent time in. The difference between "p95 is high" and "p95 is high because the
getUserPreferencesSQL query is slow on this specific code path". - Service maps — automatic discovery of which services call which, with latency and error rates on each edge. Critical for any architecture above ~5 services.
- Code-level profiling — flame graphs of where CPU time is being spent inside your application. The difference between "the app is slow" and "the app is slow because regex compilation is happening on the hot path".
The cost of an APM is real (per-host or per-trace pricing can be steep) and the operational complexity isn't trivial — instrumenting an application properly takes effort, and the data only pays back if your team is set up to use it during incidents.
The honest framing: most teams under ~10 services don't need a full APM. Good metrics on the four golden signals + structured logs + synthetic monitoring covers them. APM is the right investment when (a) you have enough services that mental modelling stops working, or (b) the cost of a slow incident is meaningfully high. Until then, simpler tools are usually the better trade.
How to start, in five steps
A pragmatic on-ramp for a team that has nothing today:
1. Uptime monitoring on the URLs that matter
Not just /. Set up an HTTP check on every URL whose failure means real users would notice — the homepage, the login page, the most-trafficked product pages, the API health endpoint, the checkout flow. Multi-region probes if your audience is global. Alert on the first failure, not the third in a row.
This is the floor; without it, you don't know when anything is broken at all. KB walkthroughs: How to set up HTTP uptime monitoring, How to set up HTTPS uptime monitoring, and (for cron-style backend jobs) How to set up heartbeat uptime monitoring.
2. Server monitoring on every host
Install a host agent on every server (or every node in your container cluster) that emits CPU, memory, disk, network, and per-process metrics. CPU pegged at 100% is something you want to know about before the request queue backs up.
For the operational details: How to monitor CPU usage on Linux, How to check running processes on Ubuntu server. Xitoring offers this through Xitogent on the host; Prometheus + node_exporter is the OSS equivalent.
3. Application metrics on the four signals
Instrument the most-trafficked endpoints to emit:
- Request latency — histogram of response times, broken down by endpoint and status code. Plot p50/p95/p99.
- Request rate — counter of requests per second, broken down by endpoint.
- Error rate — counter of 5xx and explicit error responses, broken down by endpoint and error type.
- Resource saturation — connection pool usage, thread pool queue depth, memory headroom on the app server.
How: most modern frameworks have OpenTelemetry / Prometheus client libraries that take a few lines of code to add. Java (Micrometer), Python (prometheus_client), Node.js (prom-client), Go (promhttp), Ruby (prometheus-client) — pick the binding for your stack.
4. Structured logs to a searchable store
Switch the app to emit logs as structured JSON (one JSON object per line, with consistent fields: timestamp, level, request_id, user_id where appropriate) instead of unstructured text. Ship to a searchable store — Loki, ELK, OpenSearch, CloudWatch Logs, or a hosted equivalent.
The single high-leverage habit: propagate a request ID through every log line for a given request, so you can grep request_id=abc123 and see the entire request's lifecycle across services. The Honeycomb / observability discourse calls this a "trace ID"; for application-level logs without full distributed tracing, request_id is the same idea.
5. SSL and cron monitoring (the silent failures)
Two failure modes that don't show up in any of the above and bite teams regularly:
- Expired certificates — certificate auto-renewal can fail silently; the site keeps working until the cert expires at 03:00 on a Sunday. SSL certificate monitoring catches this. See also How to renew an SSL certificate.
- Cron jobs that didn't run — a missed nightly backup or rotation job can go unnoticed for days. Cron job heartbeat monitoring catches this within minutes.
Both are ten-minute setups and protect you from a class of incident that traditional monitoring is structurally bad at detecting.
What "good" application monitoring looks like
After step 5, here's the picture in a healthy small-team setup:
- When the website goes down, you're paged within a minute.
- When server CPU or memory crosses into trouble, you're alerted before the queue backs up.
- When the app's p95 latency degrades from 200 ms to 800 ms, you see it in a graph and can act before users feel it.
- When a specific endpoint's error rate spikes, you have logs with request IDs ready to query for context.
- When the cert is 14 days from expiry, you get a low-priority alert with two weeks to fix it.
- When the nightly backup doesn't run, you know within minutes — not at the next disaster recovery test.
This is application monitoring done well at the small-team scale. It is achievable with mostly-free tools and a few hours of work over a couple of weeks. It will not match a Datadog APM rollout in depth, but it will catch and contextualise the vast majority of incidents — which is the actual job.
For teams ready to grow beyond it: APM, distributed tracing, and the high-cardinality observability stack are the next investments. They become worth the cost when your incident debugging routinely involves "I have a hunch but I can't prove it without a trace" — and not before.
A note on what's not application monitoring
A few patterns that often get filed under "application monitoring" but really belong elsewhere:
- "Did my CI run?" — that's CI monitoring, a different category. Most CI tools have it built in.
- "Did anyone log in this morning?" — that's product analytics (Mixpanel, Amplitude, etc.), not application monitoring. Different signals, different tools, different teams looking at the data.
- "How many feature-flag rollouts succeeded?" — that's a feature-flag platform's job (LaunchDarkly, Unleash, etc.).
- "Is my AWS bill normal?" — that's cost monitoring, again a different category.
This isn't a strict taxonomy — the lines blur in practice — but the practical reason to keep them separate is alerting routing. The on-call engineer doesn't want to be paged when a marketing dashboard's daily-active-users count drops; the marketing team doesn't want to be paged at 03:00 when a Kubernetes node OOM-kills a pod. Different audiences, different signals, different tools.
Frequently Asked Questions
What is application monitoring?
Application monitoring is the practice of tracking how your application code behaves at runtime — request latency, error rates, throughput, and resource saturation — so you can detect and diagnose problems before users feel them. It's distinct from server monitoring, which watches the host's CPU, memory, and disk, and from uptime monitoring, which checks whether the service responds from outside.
What's the difference between application monitoring and APM?
APM (Application Performance Monitoring) is a richer, heavier category of application monitoring. Basic application monitoring instruments the four signals — latency, traffic, errors, saturation — and tells you that something is slow. A full APM platform (Datadog, New Relic, Dynatrace) adds per-request tracing, code-level profiling, and automatic service maps that tell you why it's slow. Most teams under ~10 services get most of the value from the four signals plus structured logs, and adopt full APM only once the system is too large to reason about in your head.
Do I still need application monitoring if I already have uptime and server monitoring?
Yes — they answer different questions. Uptime monitoring sees a healthy 200 and server monitoring sees normal CPU even while a slow database query is tripling your p95 latency. Only application monitoring watches your code's behaviour directly, so it's the layer that catches the degradations users actually feel before they turn into outages.
Bottom line
Application monitoring is the layer that watches your code — not the infrastructure under it (server monitoring), not the URL from outside (uptime monitoring). The four signals (latency, traffic, errors, saturation) cover the majority of what matters; metrics for alerting and logs for context cover most workflows; synthetic + RUM together cover both the SLA-truth and the user-experience-truth dimensions.
For most teams below ~10 services, a pragmatic stack of uptime + server + application metrics + structured logs + SSL/cron monitoring catches the incidents that matter and costs less than a single team-member's time to operate. Full APM platforms become the right investment when the system is large enough that mental modelling stops working.
For the operational primitives that anchor this — uptime monitoring, server monitoring, SSL certificate monitoring, cron job monitoring — the same signals are useful whether you're calling it monitoring or observability or SRE or just "knowing what's going on". The marketing word is downstream of the data; the data is what's load-bearing. Start with the four signals; everything else is a more elaborate way of asking the same questions.