CoreDNS Monitoring
Monitor CoreDNS query throughput, response-code distribution (NOERROR/NXDOMAIN/SERVFAIL/REFUSED), cache hit ratio, forward latency, and health-plugin failures in real time — via the native `prometheus` plugin on `:9153`.
Why monitor CoreDNS?
CoreDNS is the default cluster DNS in Kubernetes — every microservice depends on it for service discovery. When CoreDNS degrades, SERVFAIL spikes, or the forward plugin slows, it shows up as 'random connection refused' everywhere in the cluster. Monitoring catches DNS issues at the source instead of debugging downstream symptoms.
CoreDNS monitoring, explained
CoreDNS monitoring catches SERVFAIL spikes, cache hit-rate drops, forward-plugin latency, and panic-related restarts before they cascade into cluster-wide DNS resolution failures. Because every microservice depends on DNS for service discovery, an unmonitored CoreDNS is an unmonitored failure mode for your entire Kubernetes cluster — DNS issues show up as "random connection refused" everywhere. Xitoring auto-discovers your CoreDNS, scrapes :9153/metrics, and routes alerts to Slack, PagerDuty, Telegram, or your existing on-call.
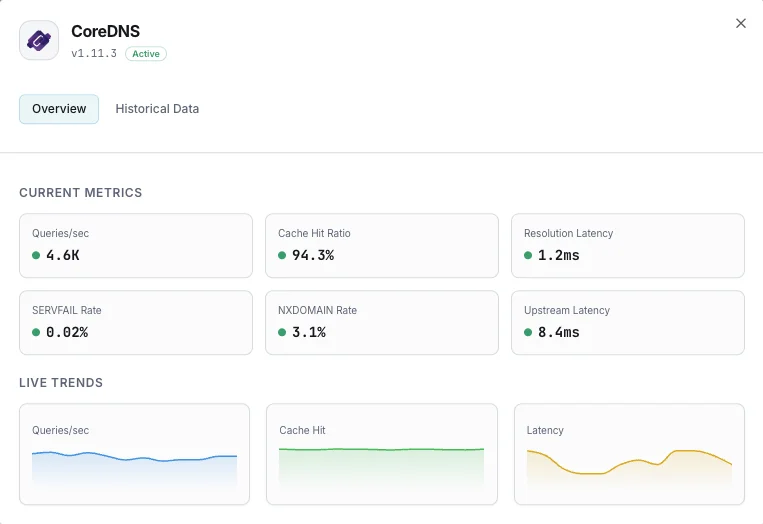
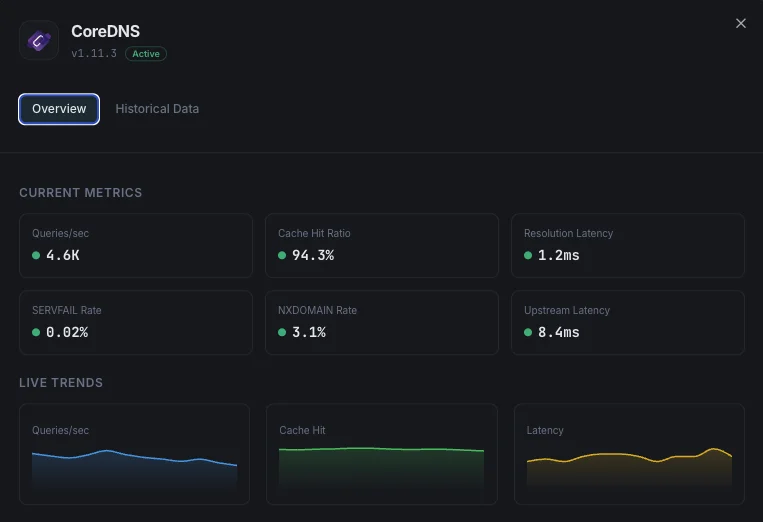
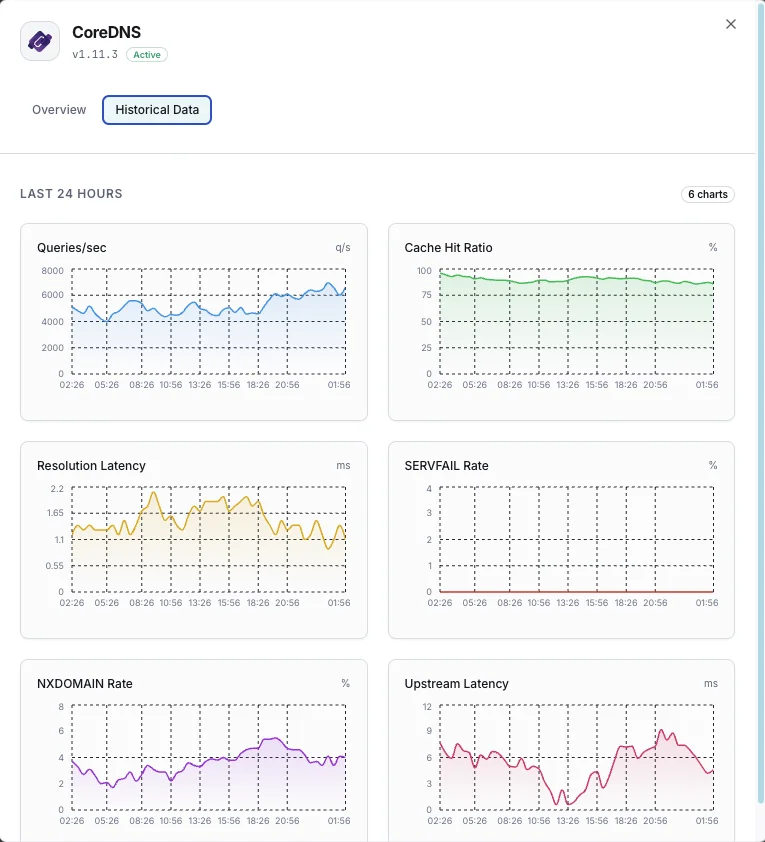
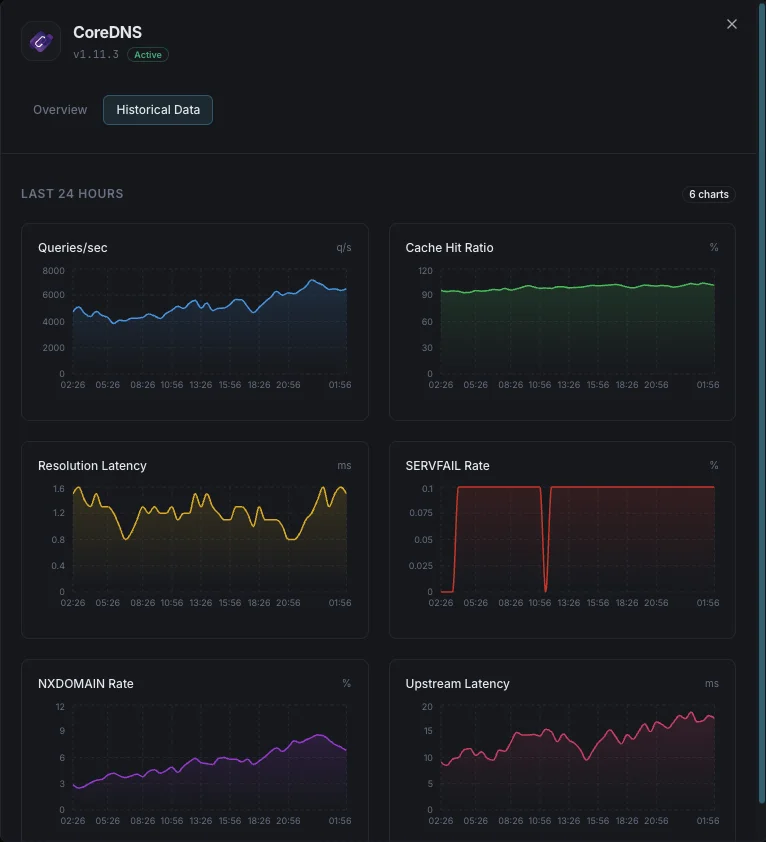
What we monitor
Queries / sec
Live DNS query throughput from `coredns_dns_requests_total`. Spikes flag DNS amplification attacks or traffic surges; sustained drops flag broken clients or misrouted ServiceMonitor scrapes.
Response Code Distribution
`coredns_dns_response_rcode_count_total` labeled by rcode — NOERROR (success), NXDOMAIN (non-existent), SERVFAIL (resolution failure), REFUSED (policy block), FORMERR (malformed).
SERVFAIL Rate
SERVFAIL responses per second. Spikes signal upstream resolver failures or forward plugin issues. PrometheusRule alert: > 5% of total query rate is the standard threshold.
Cache Hit Ratio
Computed as `coredns_cache_hits_total / (coredns_cache_hits_total + coredns_cache_misses_total)`. Target 80%+ on cluster DNS; below 50% means the cache TTLs are too short or the working set exceeds cache size.
Cache Size / Entries
`coredns_cache_size` (bytes) and `coredns_cache_entries` per cache type (success vs denial). Approaching the configured cache size triggers eviction.
Resolution Latency (histogram)
`coredns_dns_request_duration_seconds` histogram — track p50, p95, p99. Cluster DNS that drifts above 100ms p99 starts causing visible app slowness; alert on p99 > 500ms.
Forward Plugin Latency
`coredns_forward_request_duration_seconds` per upstream resolver. Separates CoreDNS-internal latency from upstream resolver latency — critical for diagnosing slow 8.8.8.8 vs slow CoreDNS itself.
Forward Request Rate
`coredns_forward_request_count_total` per upstream. Combined with cache hit ratio shows how much traffic actually leaves CoreDNS for upstream resolution.
Proxy Connection Cache
`coredns_proxy_conn_cache_hits_total` / `_misses_total`. Tracks TCP connection reuse to upstream resolvers — low hit rate means connection churn, raising upstream latency.
Health Plugin Failures
`coredns_health_request_failures_total` — the `health:8080` plugin's own failure count. Non-zero means the liveness probe is failing intermittently.
Panics
`coredns_panics_total` — any non-zero value is a CoreDNS bug or plugin crash that triggered a goroutine panic. Pair with restart count for full post-mortem context.
Go Runtime
`process_resident_memory_bytes` (RSS), `go_goroutines` (goroutine count — detects leaks), `go_gc_duration_seconds` (GC pause time). Memory growth without restarts = leak; goroutine count growth = blocked plugin or upstream.
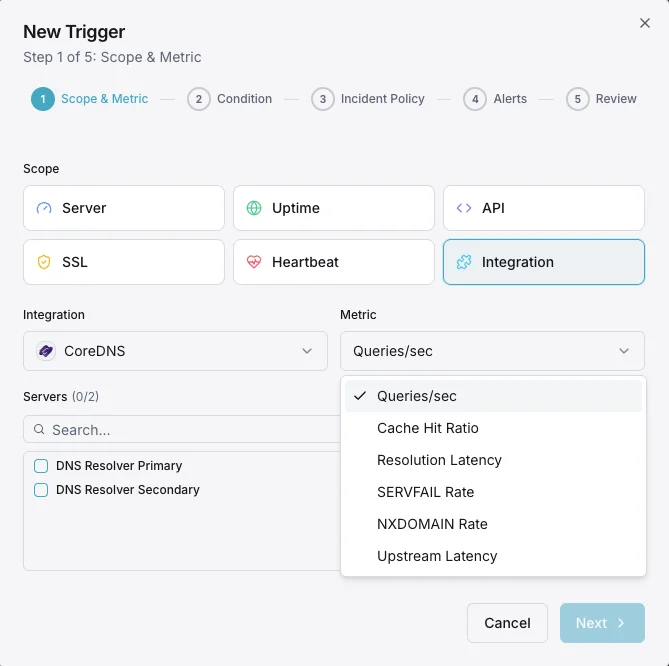
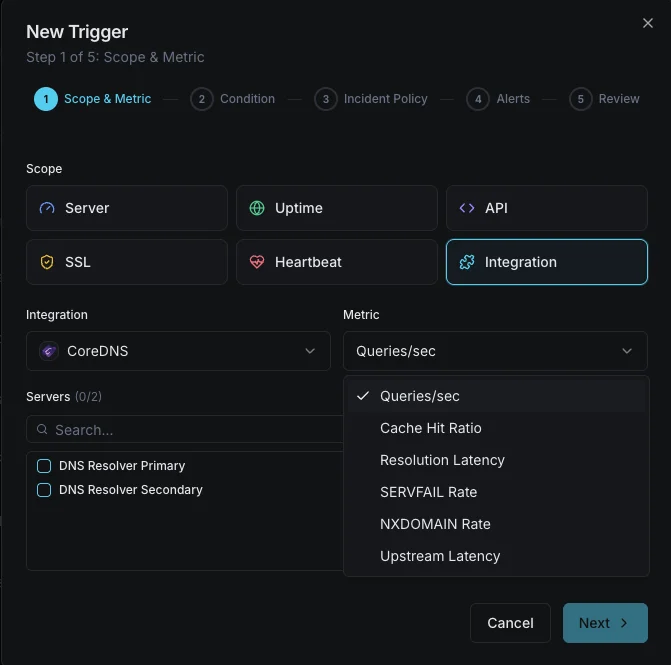
Configurable alert triggers
Set up custom triggers in your dashboard to get notified the moment CoreDNS metrics cross your defined thresholds.
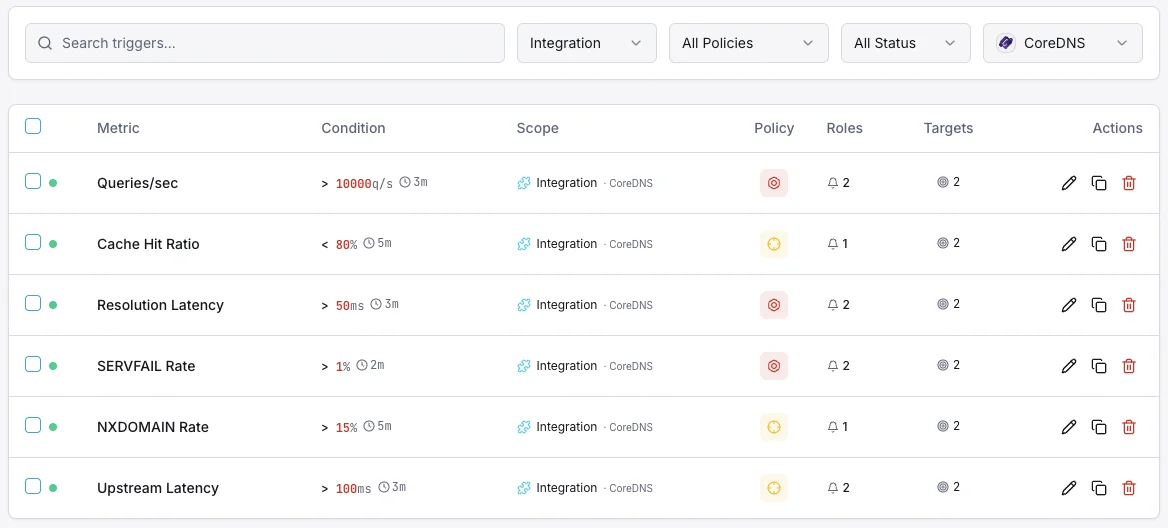
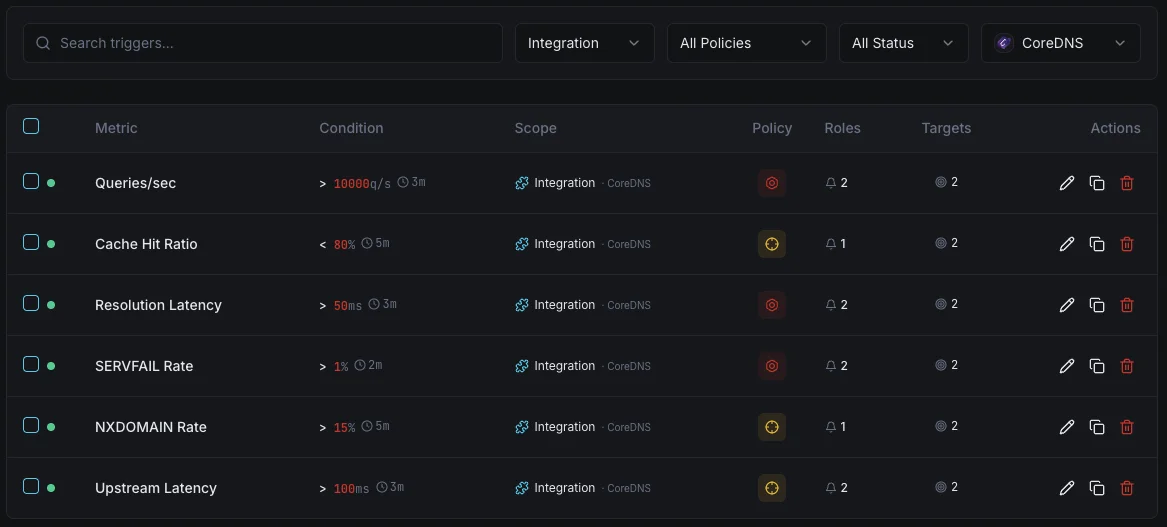
SERVFAIL Rate
criticalFires on high resolution failure rate.
Cache Hit Ratio
warningAlerts when cache effectiveness drops.
Resolution Latency
warningTriggers on slow DNS resolution.
Query Rate
warningFires on unusual query volume.
Importance of CoreDNS Monitoring
DNS is the foundation of network connectivity. Slow or failing DNS resolution impacts every service in your infrastructure.
- Ensure fast DNS resolution
- Detect SERVFAIL spikes immediately
- Monitor cache for optimal performance
- Track upstream resolver health
Why Choose Xitoring
Zero-config CoreDNS monitoring.
- One-command install
- Global nodes
- Unified dashboard
- Multi-channel alerts
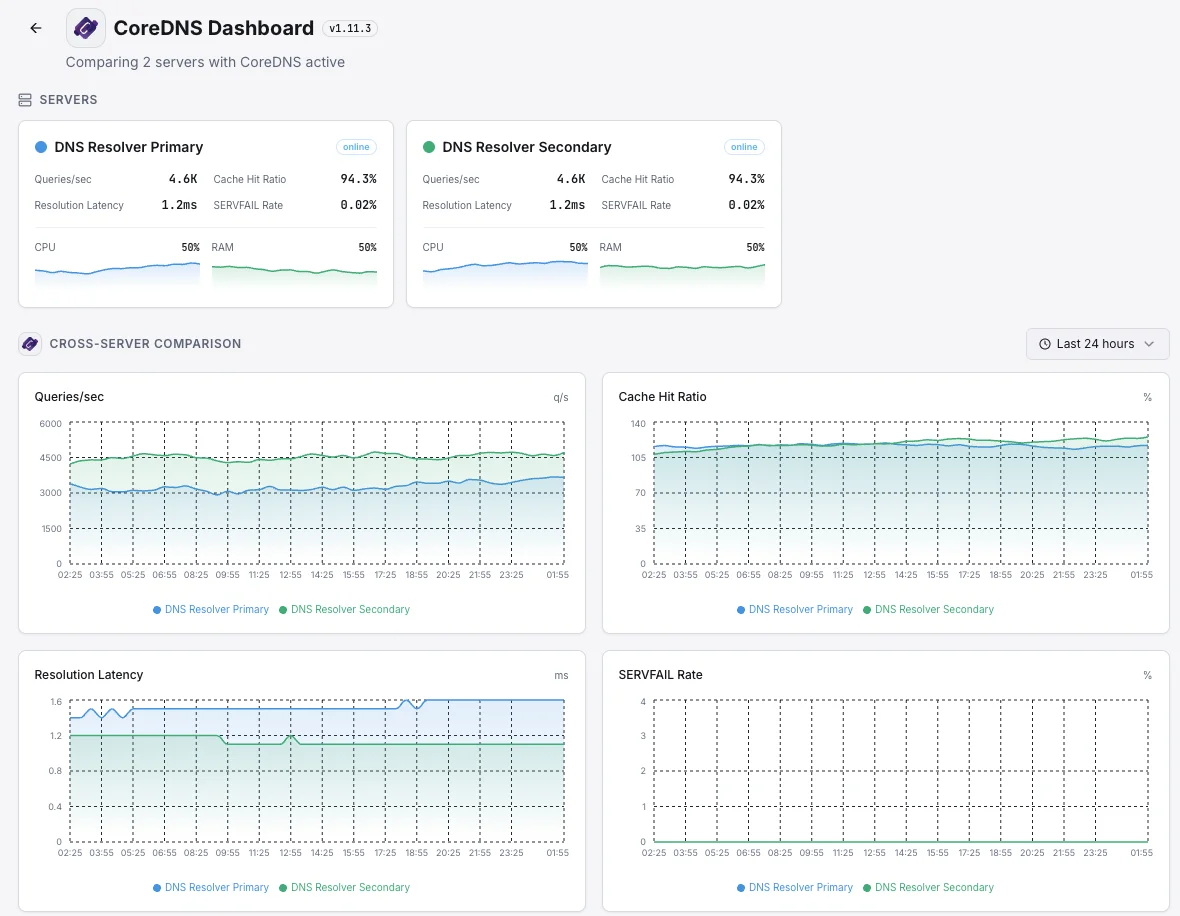
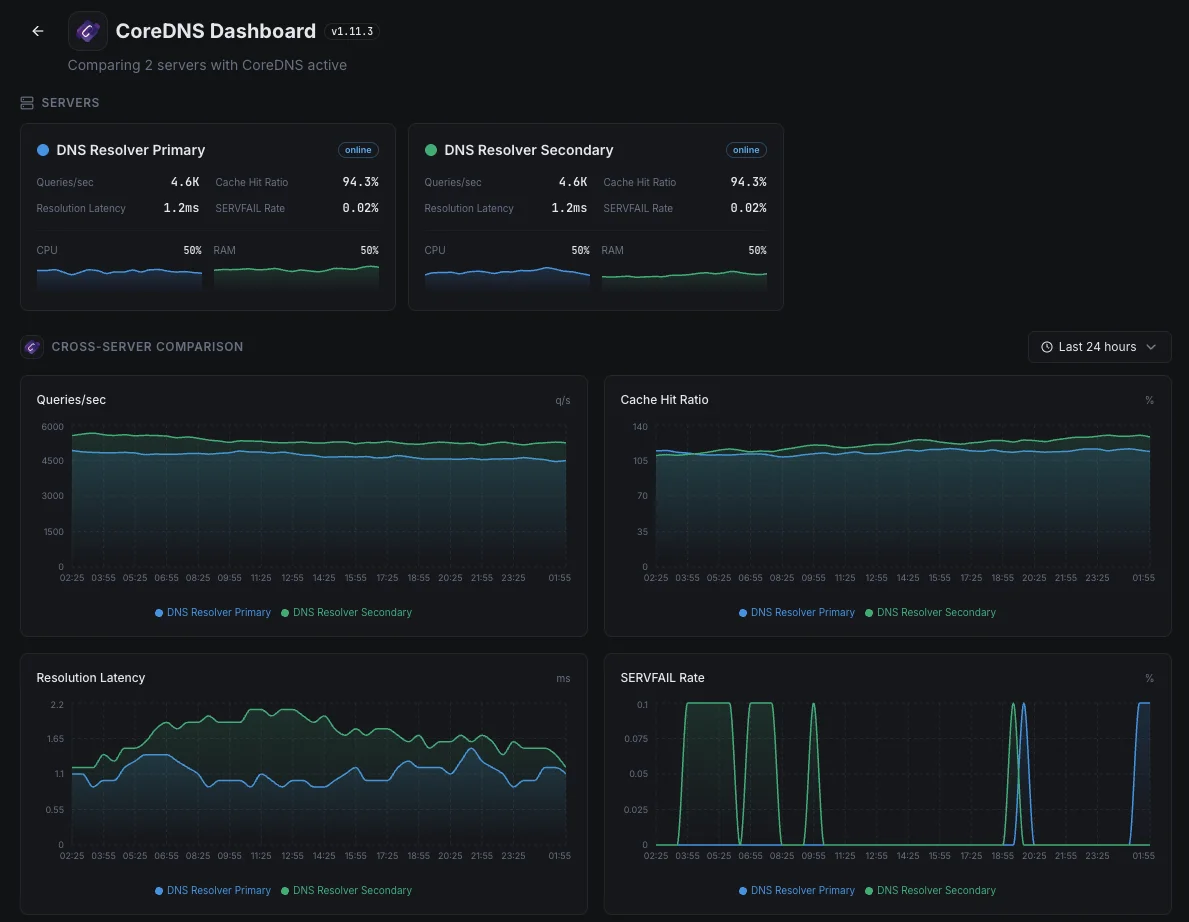
Common CoreDNS monitoring scenarios
Where CoreDNS typically runs today — and what could go wrong if no one's watching.
DNS inside a Kubernetes app
Every part of a Kubernetes app uses CoreDNS to find every other part. When it slows down or starts failing, users see strange, intermittent errors across the entire app. We catch the slowdown the moment it begins, so a small DNS hiccup doesn't surface to customers as a mysterious outage.
Large clusters with local DNS caches
Bigger Kubernetes setups put a small DNS cache on every server to keep things fast. When one of those caches misbehaves, only a slice of traffic breaks — making it hard to spot. We make sure each one is doing its job so a single bad node can't quietly degrade a fraction of your users.
Public-facing DNS for your domain
When CoreDNS is what answers DNS queries for your domain on the open internet, an outage means people can't reach your site at all. We watch the signals that prove the service is healthy and responding, so brand and revenue aren't quietly bleeding while DNS silently fails.
Prerequisites for CoreDNS
Make sure you've got these in place — most installs are a 60-second job once they are.
- CoreDNS 1.11.x / 1.12.x / 1.13.x running on the server (or in Kubernetes via the
kube-system/corednsDeployment) prometheusplugin enabled in your Corefile (default:9153)- Network reachability from Xitogent to the metrics endpoint (
/metricson:9153)
Get started in minutes
Install Xitogent on your server
If you haven't already, install the lightweight Xitogent monitoring agent on the host running CoreDNS.
curl -s https://xitoring.com/install.sh | sudo bash -s -- --key=YOUR_API_KEYEnable the prometheus plugin in CoreDNS
CoreDNS exposes Prometheus-format metrics through its prometheus plugin (default endpoint:9153/metrics). Add `prometheus:9153` to your Corefile and reload CoreDNS, then confirm the metrics endpoint is reachable from the agent host.
sudo xitogent integrateEnable the CoreDNS integration
Use the Xitoring dashboard or CLI to enable the CoreDNS integration. Xitogent auto-detects the metrics endpoint and starts collecting query, cache, and latency metrics.
Configure alert thresholds (optional)
Set custom thresholds for SERVFAIL Rate, Cache Hit Ratio, or Resolution Latency to get notified the moment DNS reliability or performance degrades.
Verify it's working
Run this command on the server to confirm Xitogent picked up the integration. Fresh metrics will start streaming to your dashboard within ~30 seconds.
sudo xitogent statusConsidering alternatives?
See how Xitoring stacks up against the alternatives for CoreDNS monitoring — flat pricing, deeper integrations, and one agent that covers your whole stack.


Frequently asked questions
What is CoreDNS monitoring?
How do I enable CoreDNS Prometheus metrics?
What does the kubernetes plugin do?
How do I monitor CoreDNS cache hit ratio?
What does NXDOMAIN mean in CoreDNS metrics?
How do I debug CoreDNS in Kubernetes?
How do I monitor CoreDNS forward plugin latency?
When should I use NodeLocal DNSCache?
What CoreDNS versions are supported?
Start monitoring CoreDNS today
Set up in under 60 seconds. No credit card required. Full metrics from day one.
Start Free Trial