
HAProxy Monitoring
Monitor HAProxy backend health, session rate vs limit, queue depth, response time, and per-server `status` in real time — via the stats socket, `/stats` page, or native Prometheus exporter.
Why monitor HAProxy?
HAProxy sits at the front of your traffic — every request flows through it before reaching any backend. Backend failures, dropped sessions, and queue buildup show up at HAProxy first, minutes before downstream services start paging on-call. Monitoring catches incidents at the entry point.
HAProxy monitoring, explained
HAProxy monitoring catches backend failures, dropped sessions, and queue buildup before they take down the services HAProxy is fronting. Because HAProxy sits at the front of your stack, monitoring it well usually means catching incidents at the entry point — minutes before a downstream service starts paging on-call. Xitoring auto-discovers your HAProxy, reads from the stats socket, /stats page, or native Prometheus exporter (whichever you've enabled), and routes alerts to your existing notification channels.
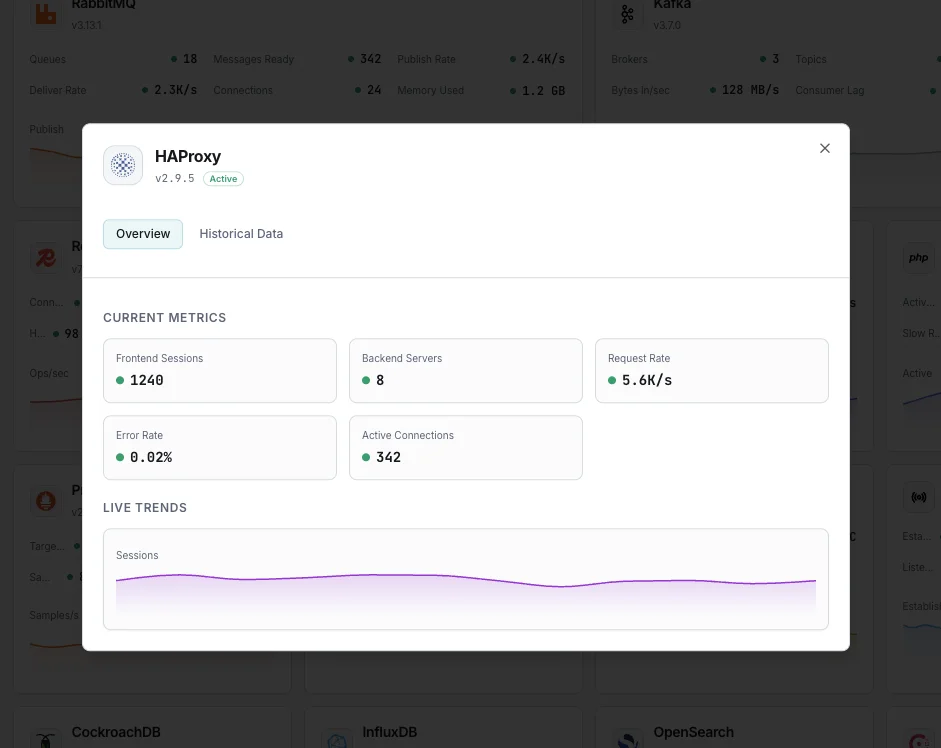
What we monitor
Session Rate
Number of new sessions per second across frontends and backends.
Active Sessions
Currently active sessions and connection count per proxy.
Backend Health
Health status (UP/DOWN) and check duration for each backend server.
Response Time
Average and max response time per backend server.
Error Rate
Connection errors, response errors, and denied requests.
Queue Length
Number of requests waiting in backend queues.
Bytes In/Out
Network throughput per frontend and backend.
HTTP 4xx/5xx
Distribution of HTTP response codes indicating client and server errors.
Retries
Connection retry count indicating backend instability.
Session Limit
Current sessions vs configured session limits per proxy.
Connection Rate
New TCP connections per second to each frontend.
Denied Requests
Requests denied by ACLs or rate limiting rules.
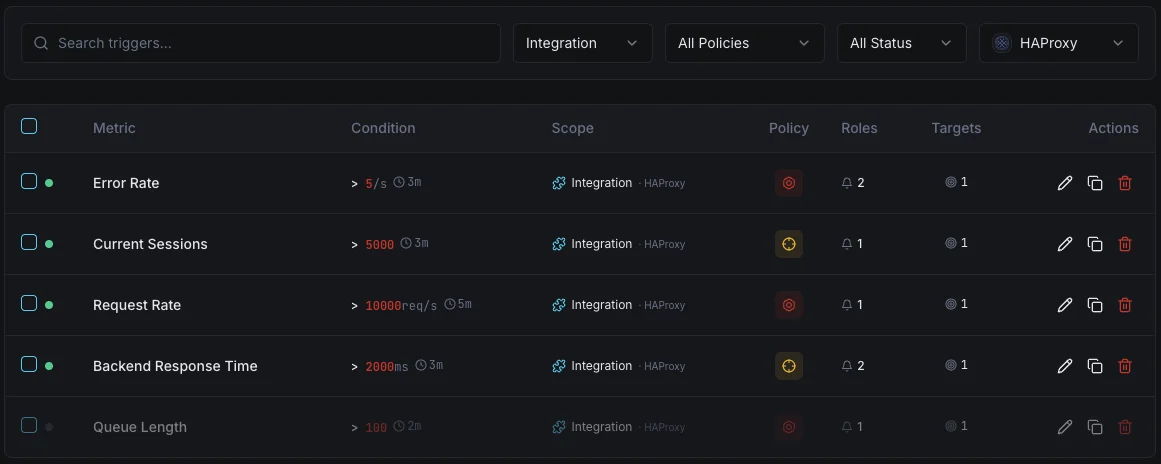
Configurable alert triggers
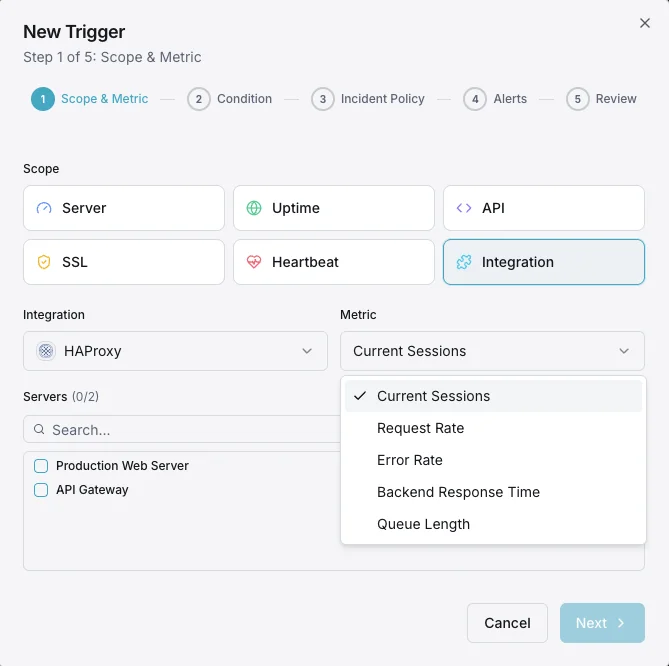
Set up custom triggers in your dashboard to get notified the moment HAProxy metrics cross your defined thresholds.
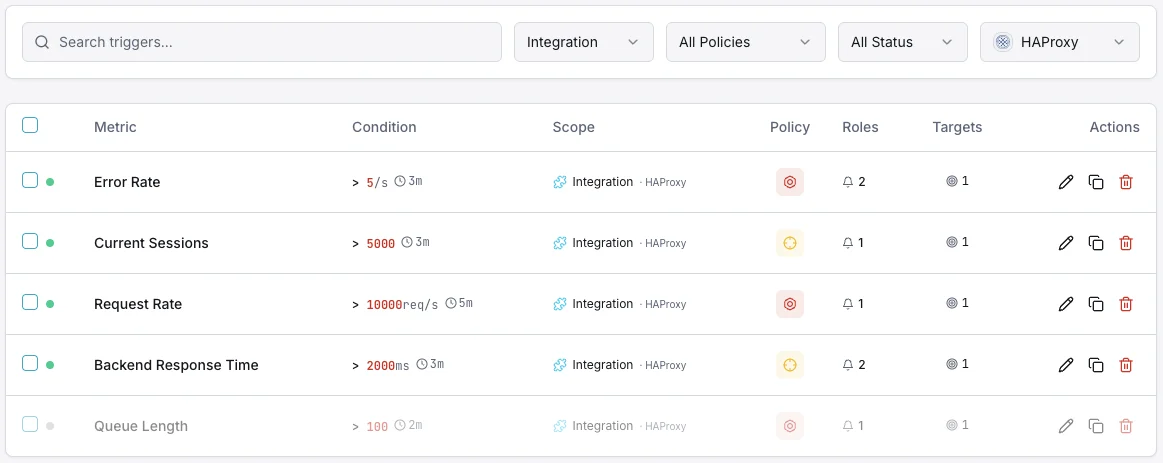
Backend Down
criticalFires when a backend server goes DOWN, reducing capacity and risking overload on remaining servers.
Response Time
warningTriggers when average response time exceeds threshold, indicating backend performance degradation.
Session Rate
warningAlerts when session rate spikes beyond normal baseline, indicating traffic surges.
Error Rate
criticalFires when connection or response error rate exceeds threshold across backends.
Queue Length
warningTriggers when requests queue up waiting for backend capacity.
Session Limit
criticalAlerts when active sessions approach the configured maximum limit.
Importance of HAProxy Monitoring
HAProxy sits at the critical path of your traffic — every request passes through it. Without monitoring, backend failures, session saturation, and response time spikes can silently degrade your entire application's availability and user experience.
- Detect backend server failures before they impact users
- Monitor response times to catch performance degradation early
- Track session rates to plan capacity for traffic surges
- Identify error patterns across backends and frontends
- Ensure load distribution remains balanced across servers
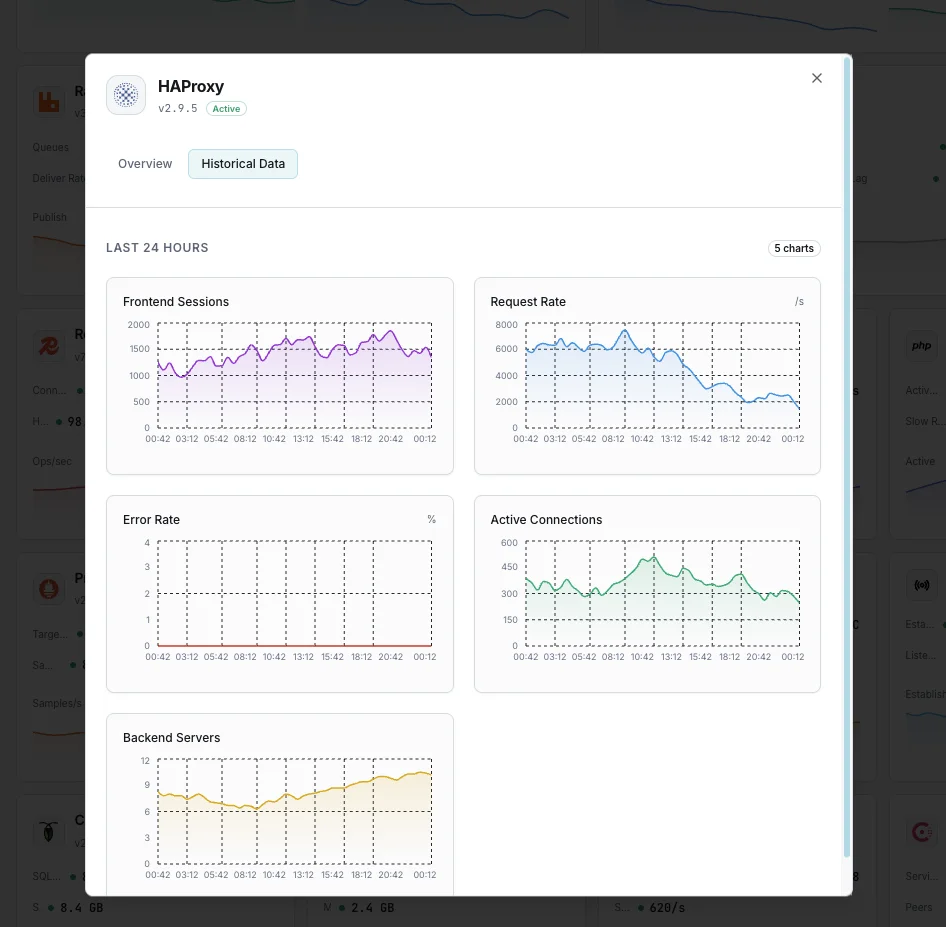
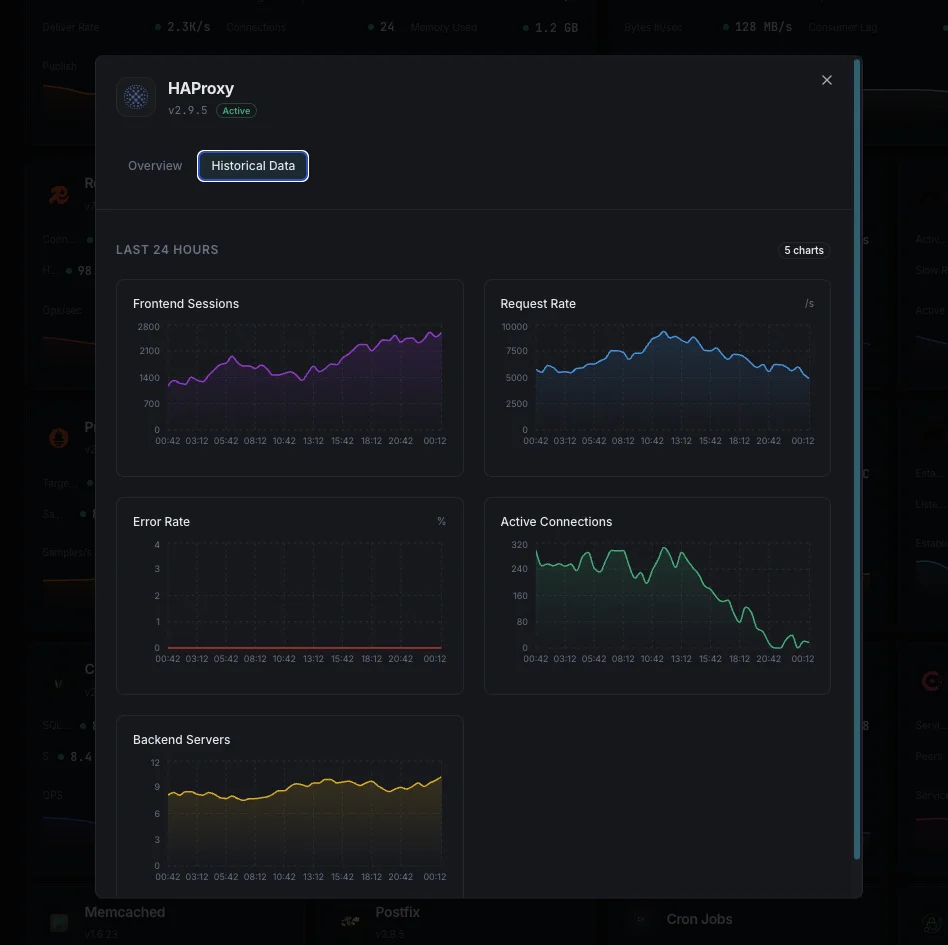
Why Choose Xitoring
Xitoring delivers enterprise-grade HAProxy monitoring with zero-config setup. Our lightweight agent auto-discovers your HAProxy instance, starts collecting metrics in under 60 seconds, and integrates with your existing notification channels.
- One-command install — no complex YAML or config files
- 15+ global monitoring nodes for low-latency checks
- Unified dashboard for servers, proxies, and uptime
- Flexible alerting via Slack, PagerDuty, Telegram & more
- Historical data retention for capacity planning & audits
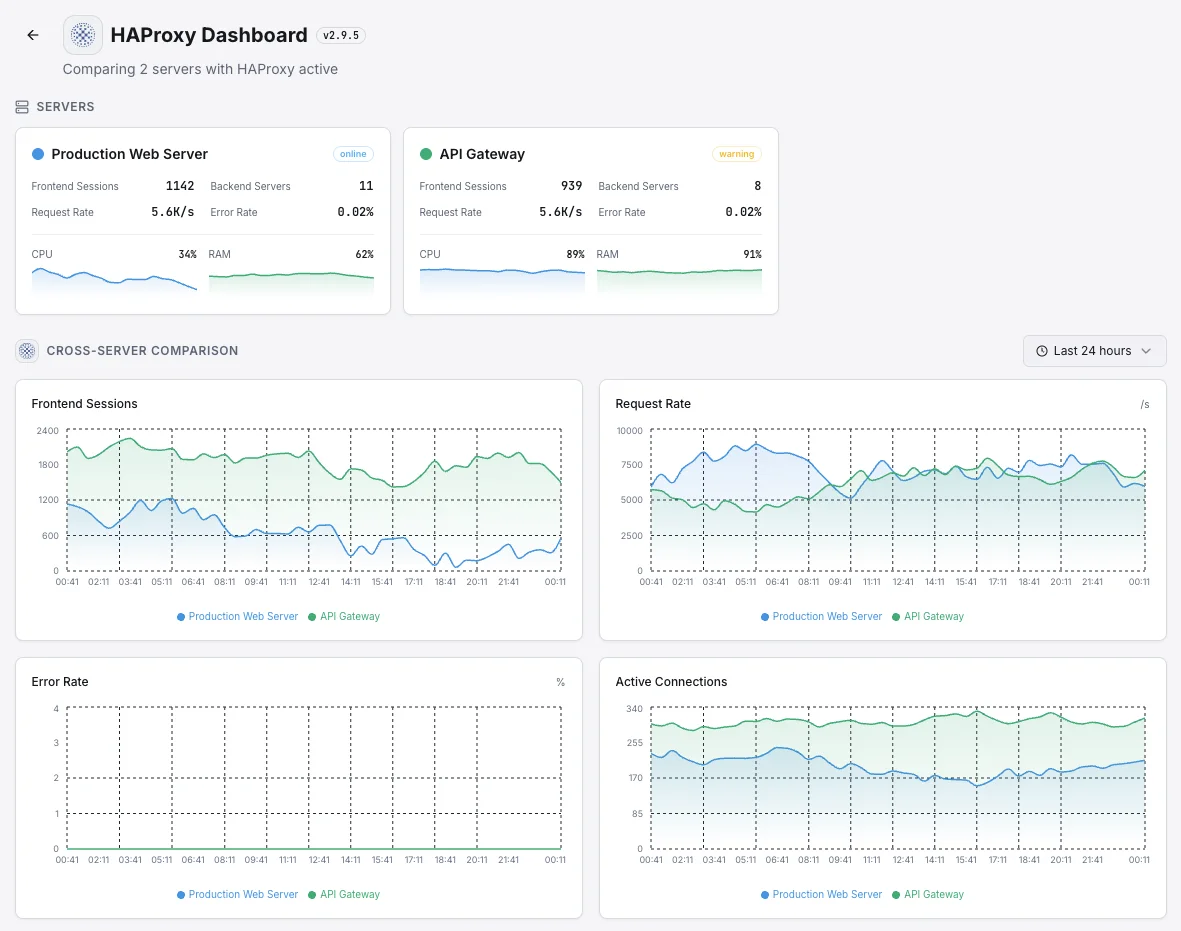
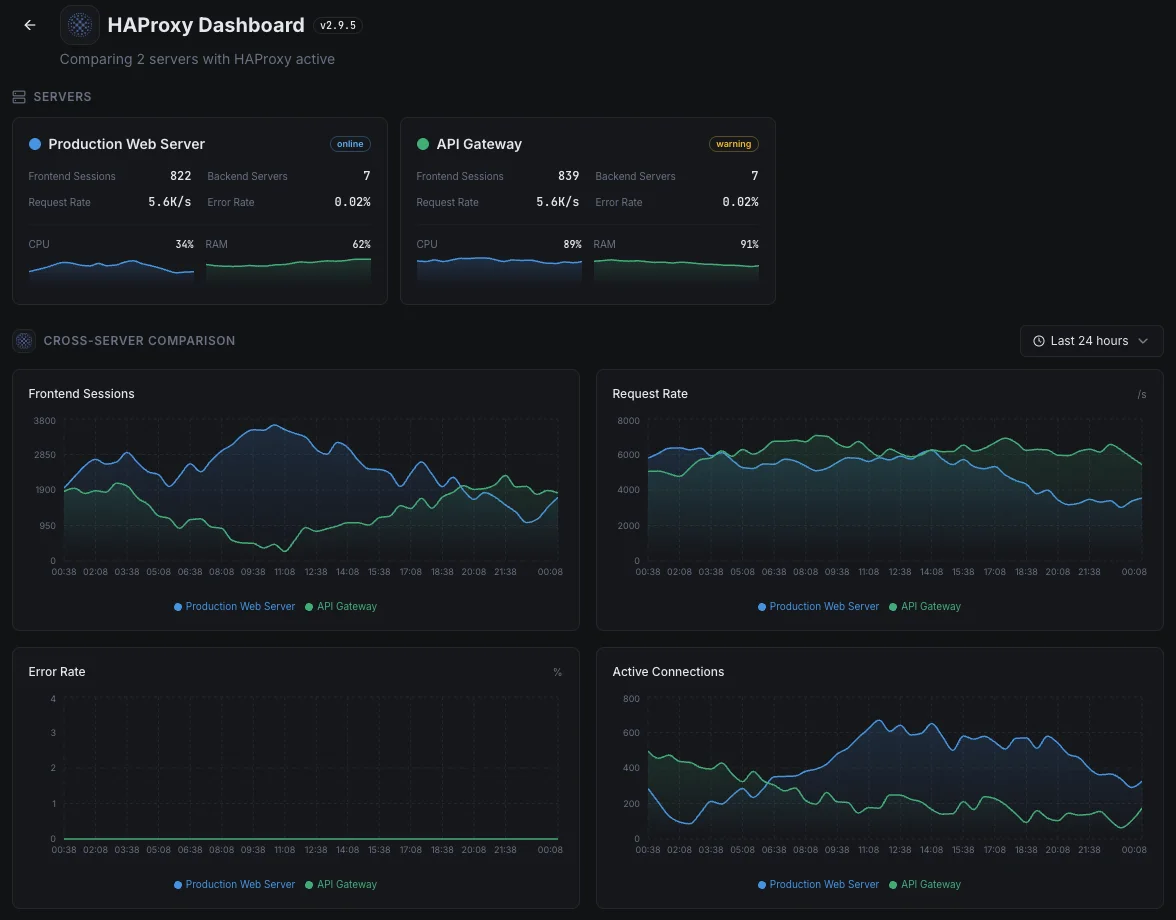
Common HAProxy monitoring scenarios
Where HAProxy typically runs today — and what could go wrong if no one's watching.
Keeping a database online during failures
HAProxy decides which database to send traffic to when the main one fails. If it doesn't notice the failure quickly — or sends traffic to a struggling backup — the app goes down anyway. We watch the handoff signals so failover does what it's supposed to: stay invisible to users.
Traffic gateway for an app or API
When HAProxy sits in front of an app or API, it sees every request and error before anything else does. We surface the patterns — slow services, rising errors, request backups — so the team knows exactly which piece to fix instead of guessing during an incident.
Entry point for a Kubernetes app
In Kubernetes, HAProxy is often the door to your entire app. A misstep there — a bad config push, a failing rollout — can briefly take everything offline. We catch the warning signs early so routine deployments don't turn into customer-visible outages.
Prerequisites for HAProxy
Make sure you've got these in place — most installs are a 60-second job once they are.
- HAProxy 2.x or 3.x running on the server (HAProxy Enterprise also supported)
- One of: a stats socket (
stats socket /var/run/haproxy.sock), the built-in HTTP stats page, or the native Prometheus exporter at/metrics(HAProxy 2.0+ withUSE_PROMEX) - Read access to the stats source for the Xitogent user
Get started in minutes
Install Xitogent on your server
If you haven't already, install the lightweight Xitogent monitoring agent on your server.
curl -s https://xitoring.com/install.sh | sudo bash -s -- --key=YOUR_API_KEYEnable the HAProxy stats socket or page
Xitogent collects metrics via the HAProxy stats interface. Ensure the stats socket is configured:
# In haproxy.cfg:
listen stats
    bind localhost:8404
    stats enable
    stats uri /
# Then provide http://127.0.0.1:8404 to xitogent integrateEnable the HAProxy integration
Use the Xitoring dashboard or CLI to enable the HAProxy integration. Xitogent will auto-detect your instance.
sudo xitogent integrateConfigure alert thresholds (optional)
Set custom thresholds for backend health, response time, or session count to get notified when something needs attention.
Verify it's working
Run this command on the server to confirm Xitogent picked up the integration. Fresh metrics will start streaming to your dashboard within ~30 seconds.
sudo xitogent statusConsidering alternatives?
See how Xitoring stacks up against the alternatives for HAProxy monitoring — flat pricing, deeper integrations, and one agent that covers your whole stack.



Frequently asked questions
What is HAProxy monitoring?
How do I enable the HAProxy stats socket?
What metrics does the HAProxy stats page display?
How do I monitor HAProxy backend health and response time?
Can I monitor HAProxy with Prometheus natively?
What is the difference between the stats socket and the HTTP stats page?
How do I track session rate vs session limit in HAProxy?
How do I use the HAProxy Runtime API to drain traffic from a server?
What HAProxy versions are supported?
Start monitoring HAProxy today
Set up in under 60 seconds. No credit card required. Full metrics from day one.
Start Free Trial