
Exim Monitoring
Monitor Exim queue depth (`exim -bpc`), frozen messages, deferred queue, delivery rate, ACL rejections, BDAT throughput, and DMARC/ARC verification rates in real time — agent-based via log parsing and `eximstats`.
Why monitor Exim?
Exim is the default MTA on cPanel/WHM (most shared hosting) and Debian. Frozen messages pile up silently, deferred queues bloat after one downstream MX goes down, and AUTH brute-force on port 587 burns sender reputation. Monitoring catches queue growth and rejection spikes in minutes — not after 50K stuck messages overnight.
Exim monitoring, explained
Exim monitoring catches frozen message buildup, deferred queue growth, ACL rejection spikes, and DMARC/ARC verification failures before they damage your sender reputation, fill the disk with stuck mail, or — on shared hosting — flood a single customer's outbound with bounces. For cPanel/WHM hosts (where Exim is the default and queue health directly drives customer satisfaction), Debian/Ubuntu MTA setups, and ISP-grade outbound mail, queue and rejection visibility is what separates a 60-second alert from finding 50,000 frozen messages the next morning. Xitoring auto-discovers your Exim, reads queue + logs, and routes alerts to Slack, PagerDuty, Telegram, or your existing on-call.
What we monitor
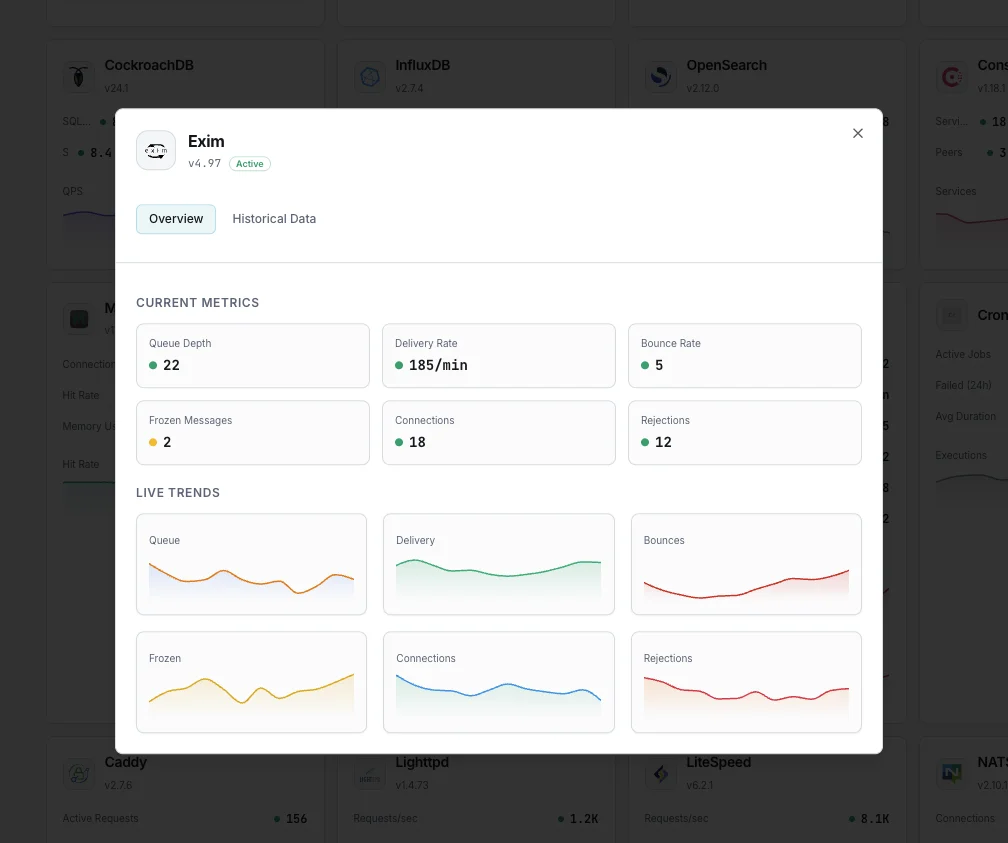
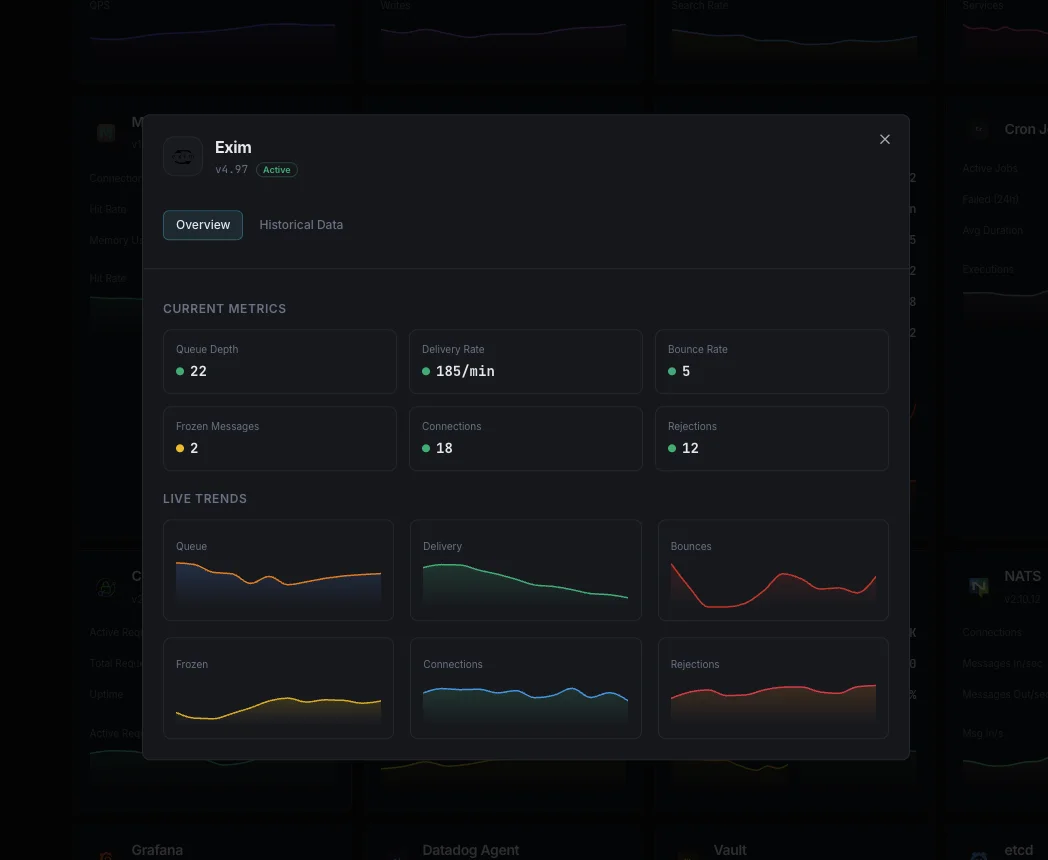
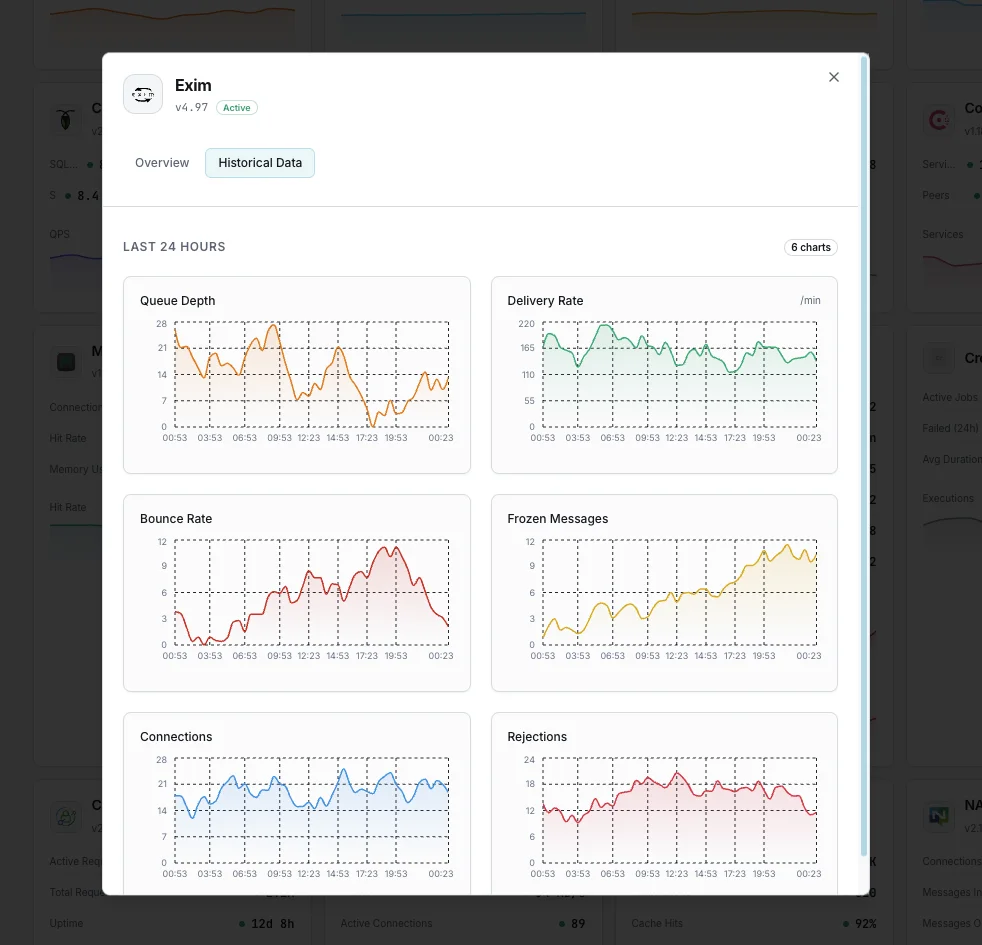
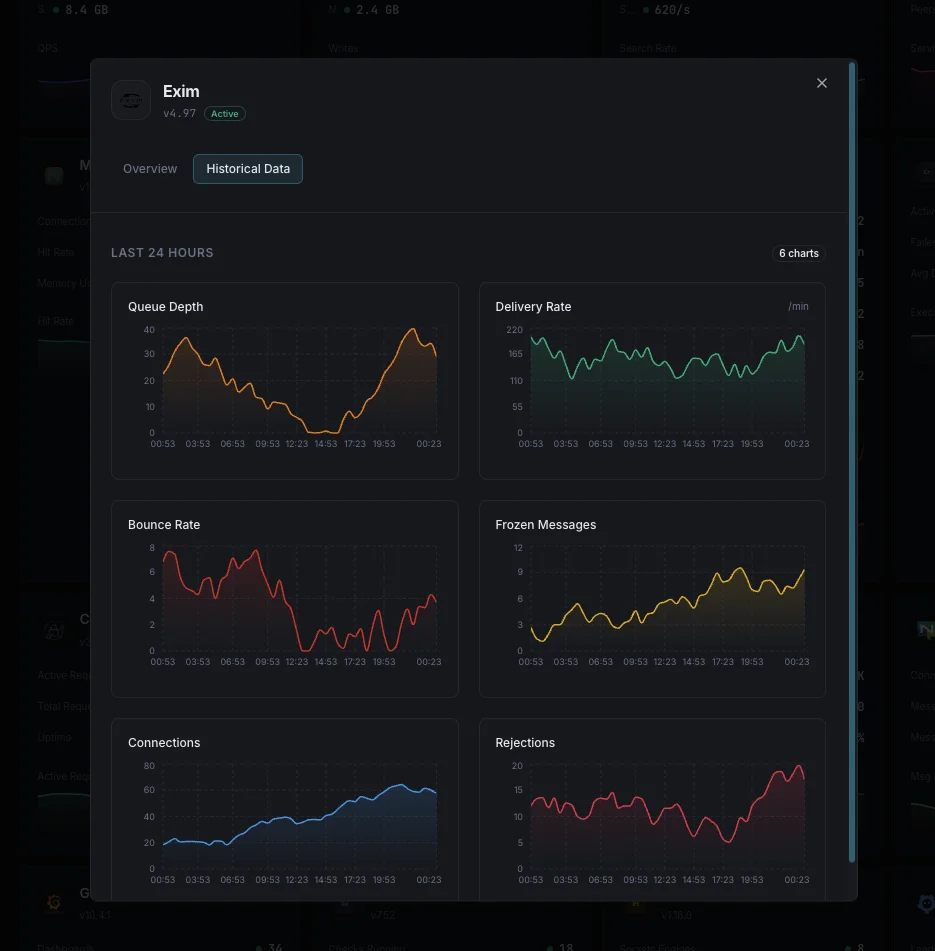
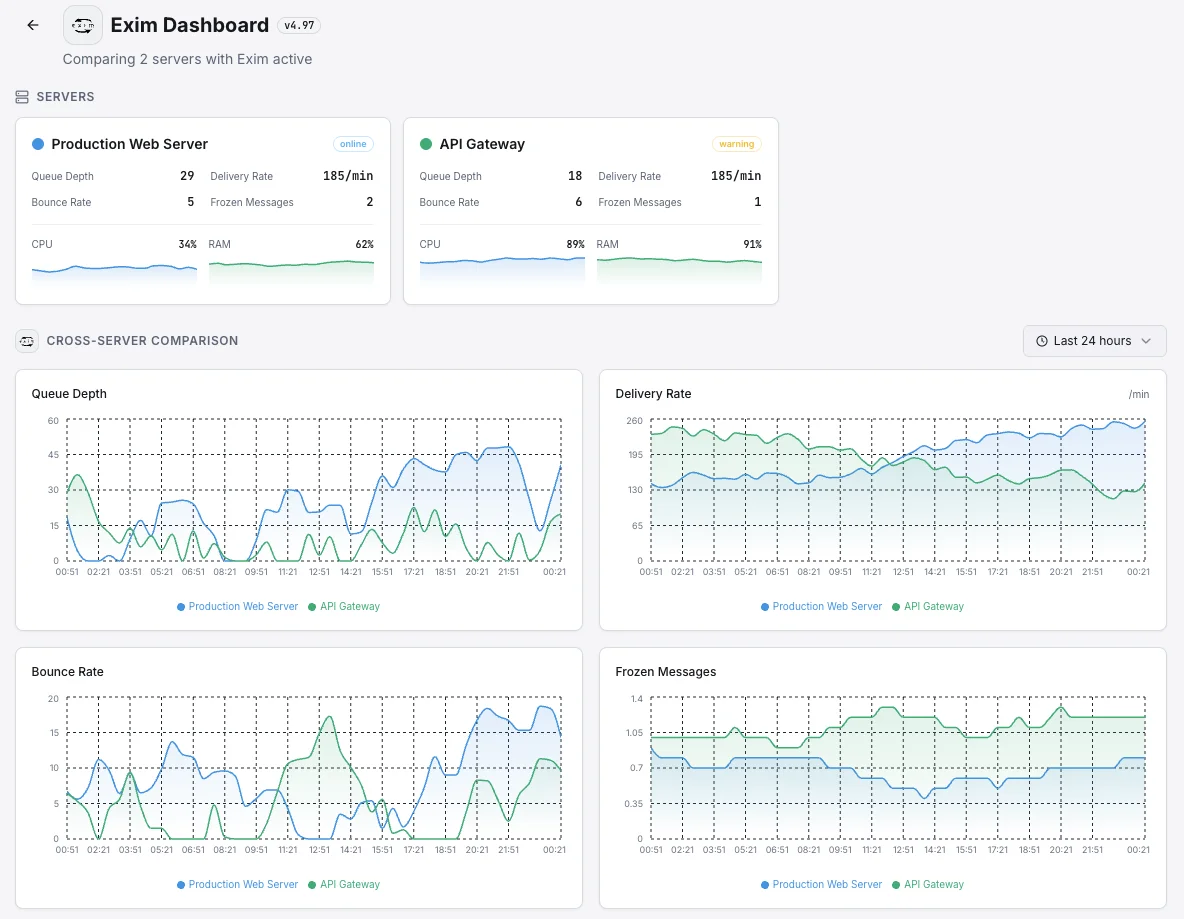
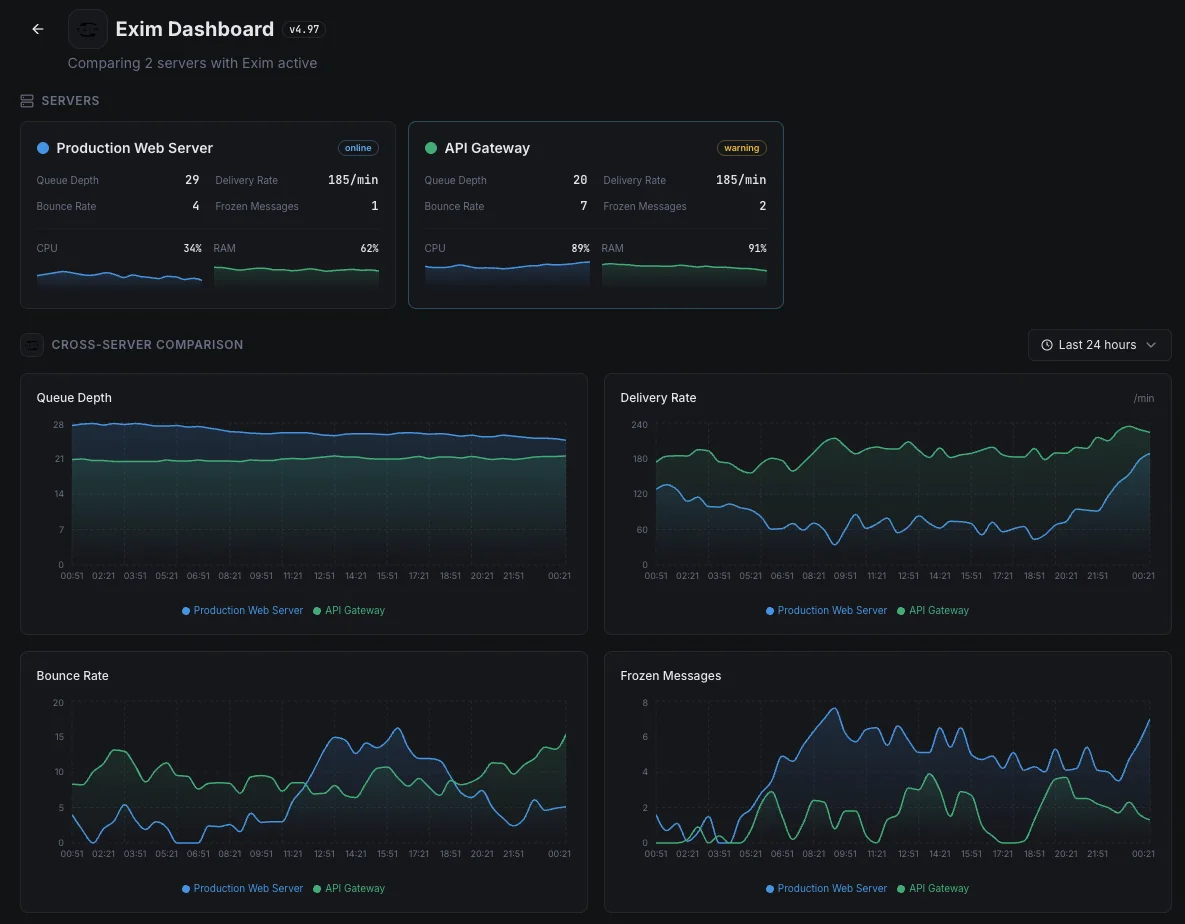
Queue Depth (exim -bpc)
Total messages in the queue (incoming + deferred + frozen). Sustained growth = downstream delivery problem or DDoS-of-bounces incident.
Frozen Messages
Messages explicitly frozen by ACLs (often spam or bounce loops) or auto-frozen after `timeout_frozen_after`. Per-message disk waste; alert on growth. Clear with `exim -Mt` (thaw) or `exim -qff` (force-flush frozen).
Deferred Queue
Messages awaiting retry after a transient failure (4xx response). Healthy steady-state is small + churning; persistent growth = downstream MX unreachable or rate-limited.
Delivery Rate (`=>` per sec)
Successful deliveries per second, from log parsing. Drops with stable receive rate = queue growth incoming.
Receive Rate (`<=` per sec)
Incoming messages per second. Sudden spikes signal traffic surges or compromised accounts blasting outbound spam.
Bounce Rate (`**` per sec)
Hard bounces (5xx) per second. High rates damage sender reputation and may indicate a compromised customer account on shared hosting.
ACL Rejection Rate
Connections / RCPTs / DATA rejected by SMTP ACLs (`acl_smtp_rcpt`, `acl_smtp_data`). Per-ACL breakdown surfaces which rule is doing the work (RBL, greylist, header check).
AUTH Failure Rate
Failed SMTP AUTH attempts from `mainlog`/`rejectlog`. Spikes = brute-force credential attack on `submission` port (587).
Queue Age Distribution
Messages by age bucket (< 1h, 1-4h, 4-24h, > 24h). Old messages = stuck delivery; cluster of mid-age messages = backed-up retry schedule.
DMARC / DKIM / SPF Verification
Verification result counts per result (pass / fail / softfail / temperror / permerror) from Exim 4.99+ DMARC module. Sender authentication health for both inbound (filtering) and outbound (own reputation).
BDAT / CHUNKING Throughput
Bytes received via BDAT (CHUNKING extension, RFC 3030). High BDAT throughput on modern Exim is healthy — older clients fall back to DATA, which is slower for large messages.
paniclog Entries
Critical errors in `paniclog` (config errors, queue corruption, sub-process crashes). Any non-zero rate = operator attention required.
Configurable alert triggers
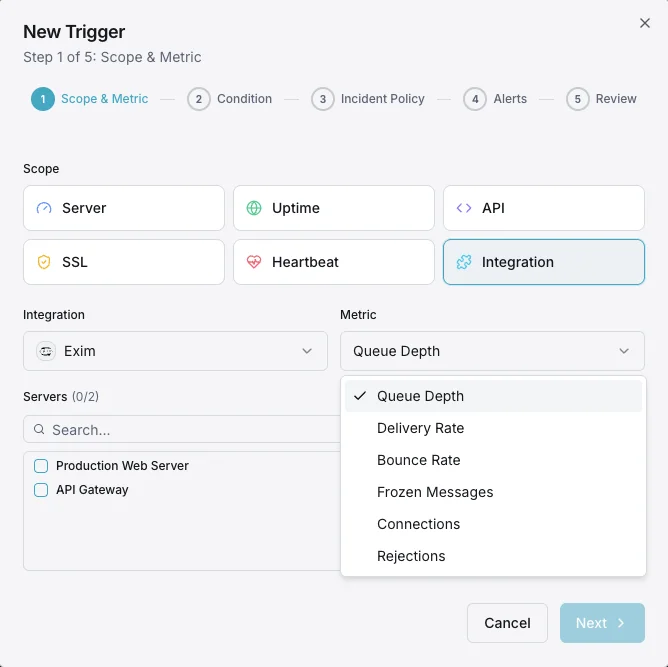
Set up custom triggers in your dashboard to get notified the moment Exim metrics cross your defined thresholds.
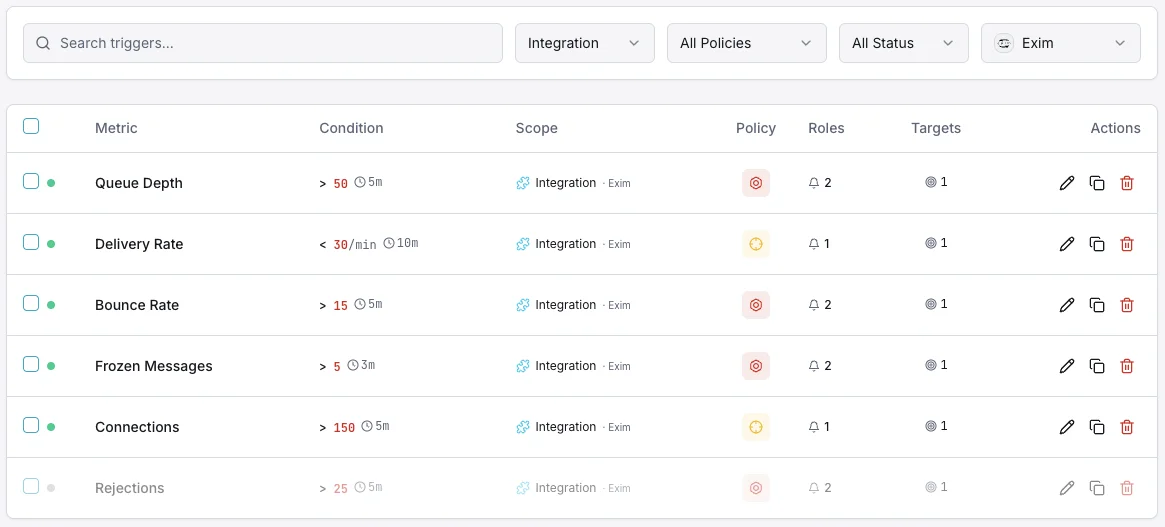
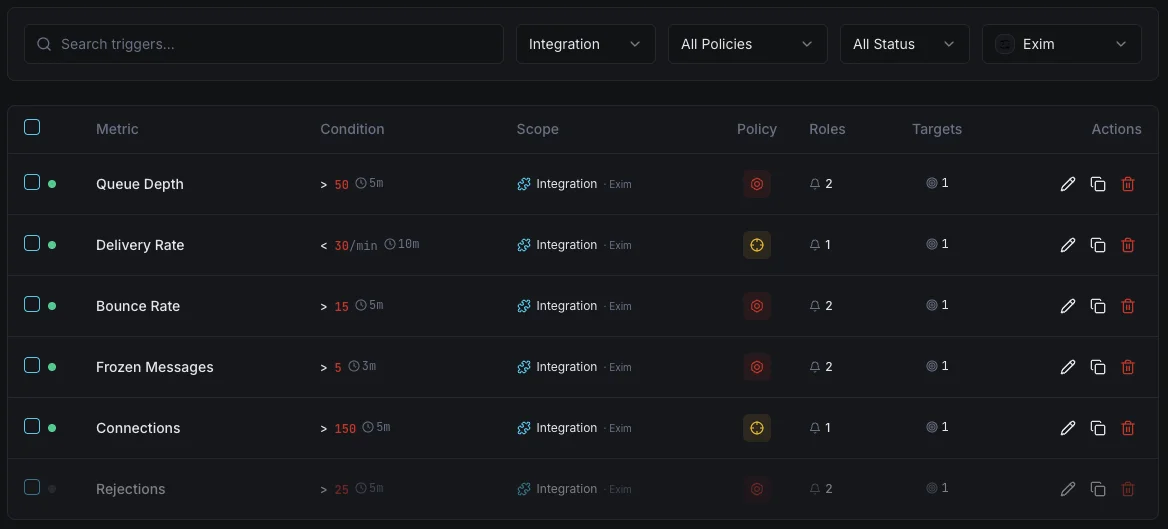
Queue Depth
criticalFires when queue grows beyond threshold.
Frozen Messages
warningAlerts on frozen message accumulation.
Bounce Rate
warningTriggers on high bounce rates.
Delivery Failures
criticalFires on delivery failure spikes.
Importance of Exim Monitoring
Exim is the default MTA on many hosting platforms. Queue buildup and delivery failures can cascade into reputation damage.
- Detect queue buildup immediately
- Track frozen messages
- Monitor delivery rates
- Prevent reputation damage
Why Choose Xitoring
Zero-config Exim monitoring.
- One-command install
- Global monitoring nodes
- Unified dashboard
- Multi-channel alerts
Common Exim monitoring scenarios
Where Exim typically runs today — and what could go wrong if no one's watching.
Email for shared hosting customers
On shared hosting, a single compromised customer account can suddenly send thousands of spam emails — getting the whole server's IP blacklisted. We catch the burst the moment it begins so reputation, deliverability, and the other customers' email aren't taken down with it.
Outbound email for servers and apps
Many Linux servers quietly use Exim to send notifications, password resets, and system alerts. When it gets stuck, those critical messages never reach the people who need them. We watch the queue so silent email failures don't turn into bigger problems downstream.
High-volume senders and email service providers
Companies sending huge amounts of email need to protect their sender reputation — once it's damaged, recovery takes weeks. We track the signals that drive deliverability so problems are spotted while there's still time to fix them, not after inboxes start rejecting your mail.
Prerequisites for Exim
Make sure you've got these in place — most installs are a 60-second job once they are.
- Exim 4 MTA (4.97 / 4.98 / 4.99 recommended) installed and running
- Read access to
/var/log/exim4/mainlog(Debian) or/var/log/exim_mainlog(RHEL/cPanel), plusrejectlogandpaniclog eximandexiqgrepbinaries on the system PATH for queue inspection
Get started in minutes
Install Xitogent on your mail server
Install the lightweight Xitogent monitoring agent on the host running Exim.
curl -s https://xitoring.com/install.sh | sudo bash -s -- --key=YOUR_API_KEYGrant log and queue access
Exim writes mail flow events to `/var/log/exim4/mainlog` (Debian/Ubuntu) or `/var/log/exim/main.log` (RHEL). Ensure the agent user can read these files and that the `exim` binary is on PATH for queue inspection.
sudo xitogent integrateEnable the Exim integration
Use the Xitoring dashboard or CLI to enable the Exim integration. Xitogent auto-detects your Exim install and begins parsing queue and delivery metrics.
Configure alert thresholds (optional)
Set custom thresholds for Queue Depth, Frozen Messages, or Bounce Rate to catch delivery problems before downstream senders notice.
Verify it's working
Run this command on the server to confirm Xitogent picked up the integration. Fresh metrics will start streaming to your dashboard within ~30 seconds.
sudo xitogent statusConsidering alternatives?
See how Xitoring stacks up against the alternatives for Exim monitoring — flat pricing, deeper integrations, and one agent that covers your whole stack.



Frequently asked questions
What is Exim monitoring?
How do I monitor Exim frozen messages?
How do I count messages in the Exim queue?
How do I monitor Exim on cPanel / WHM?
What are Exim ACLs and how do I monitor rejections?
How do I read /var/log/exim_mainlog?
How do I unfreeze Exim messages?
Postfix vs Exim monitoring — what's different?
Will the integration affect Exim performance?
Start monitoring Exim today
Set up in under 60 seconds. No credit card required. Full metrics from day one.
Start Free Trial