
Postfix Monitoring
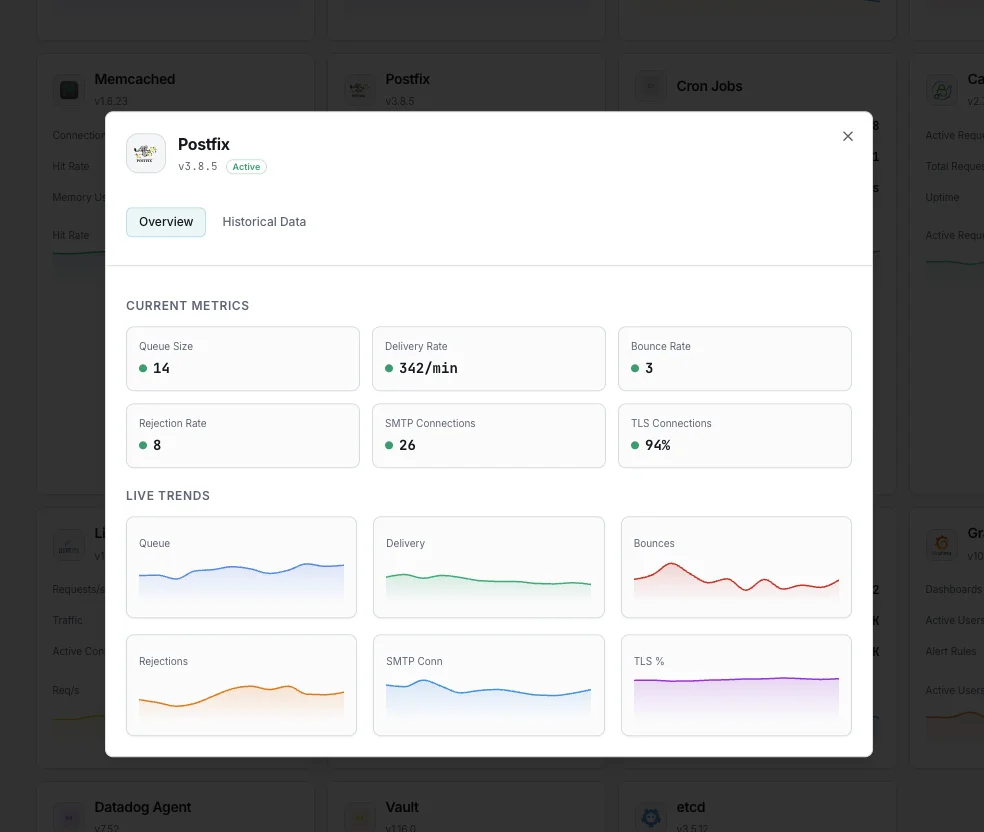
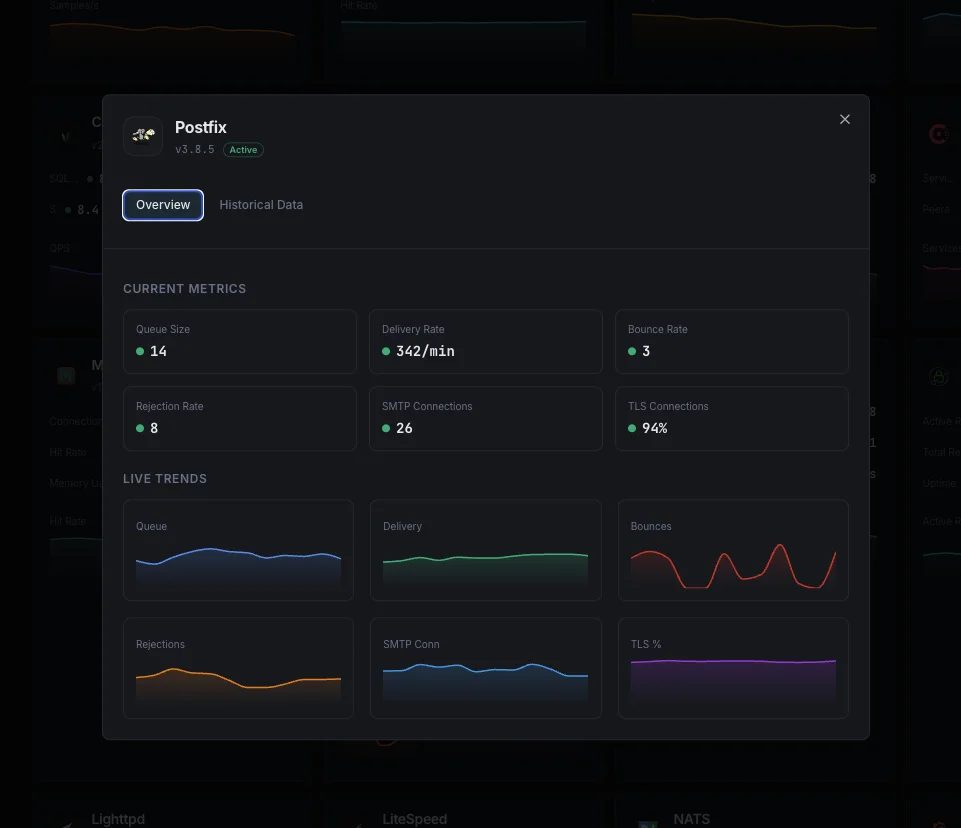
Monitor Postfix per-queue depth (incoming / active / deferred / hold / corrupt / bounce), deliveries/sec, rejection rate, postscreen DNSBL hits, and TLS encryption rate in real time — via `postqueue`, `qshape`, and log parsing.
Why monitor Postfix?
Postfix is the most-deployed MTA — running as outbound relay for SaaS apps, the engine behind Mailcow/iRedMail, and ISP-grade bulk hosts. Deferred queue buildup signals downstream MX failure; bounce-rate spikes damage sender reputation; postscreen alerts surface incoming spam blasts. Monitoring catches each in minutes, not after the disk fills with stuck mail.
Postfix monitoring, explained
Postfix monitoring catches deferred-queue buildup, bounce-rate spikes (sender reputation damage), postscreen DNSBL exhaustion, TLS handshake failures, and incoming flood patterns before they cause stuck mail, blocklist additions, or full disk from the spool. For outbound relays (SaaS apps sending transactional mail), Mailcow / iRedMail self-hosted appliances, and mailing-list hosts, queue + rejection visibility is what separates a 60-second alert on a downstream MX going dead from finding 100K deferred messages tomorrow. Xitoring auto-discovers your Postfix, reads queue + logs, and routes alerts to Slack, PagerDuty, Telegram, or your existing on-call.
What we monitor
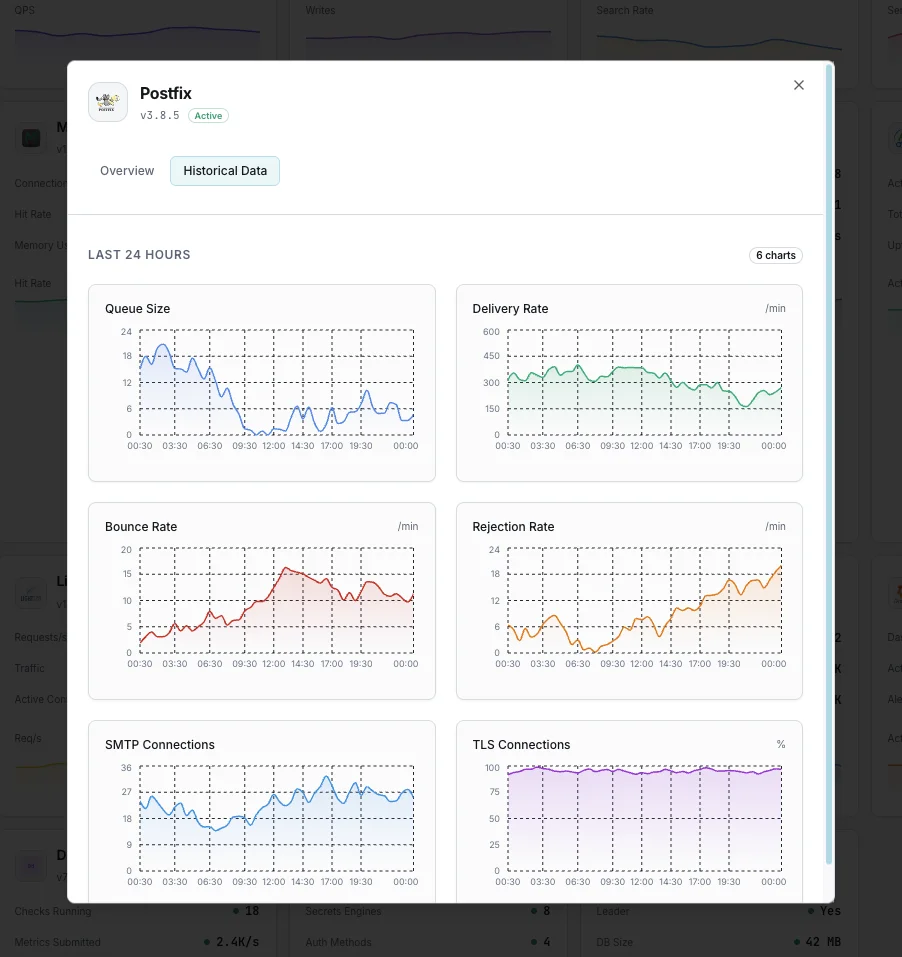
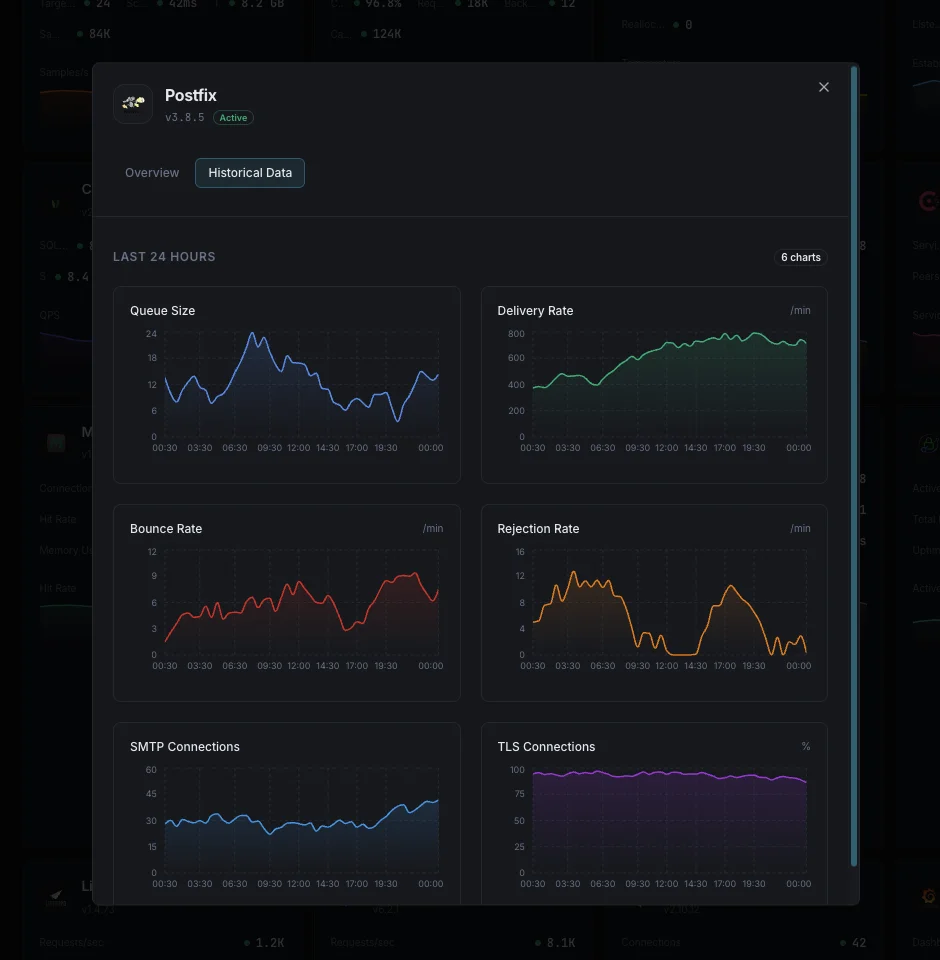
Queue Depth (per queue)
Counts for incoming, active, deferred, hold, corrupt, bounce, defer queues. Each has different operational meaning — deferred growth = delivery problem; hold growth = ACL freezes; corrupt growth = needs `postsuper`.
Deferred Queue Size
Messages awaiting retry after a transient (4xx) failure. Healthy steady-state churns; sustained growth = downstream MX unreachable, rate-limited, or your IP on a blocklist.
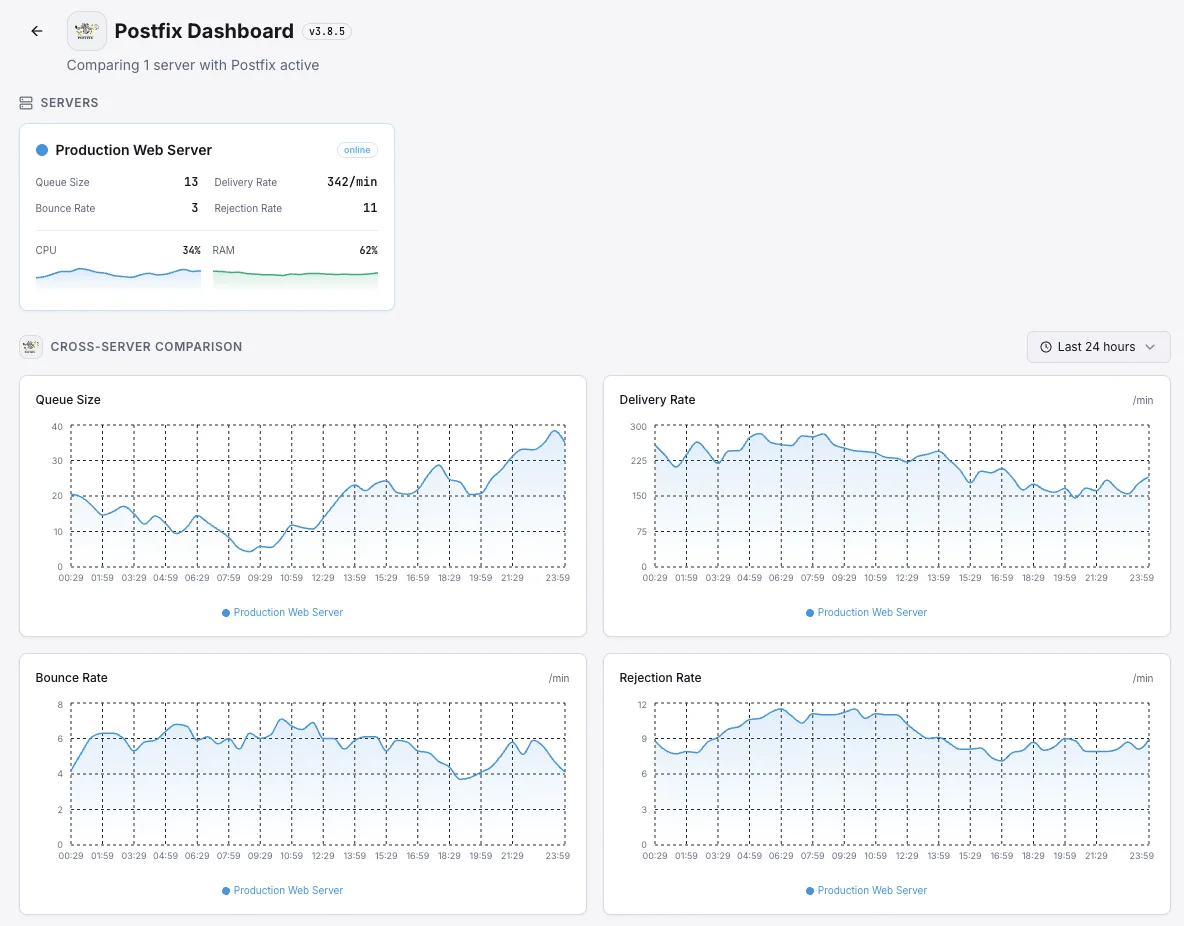
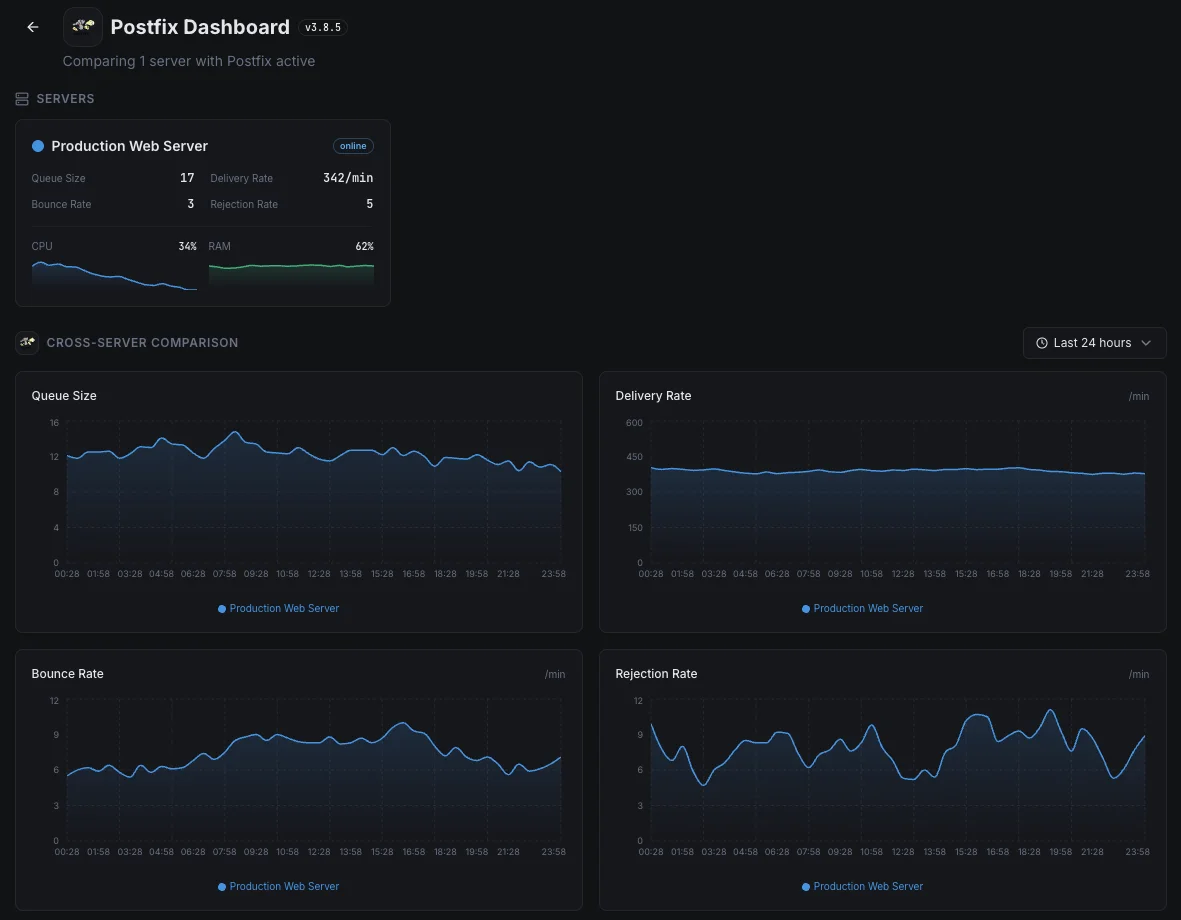
Delivery Rate (status=sent)
Successful deliveries per minute from log parsing. Drops with stable receive rate = queue growth incoming.
Bounce Rate (status=bounced)
Hard bounces per minute. High rates damage sender reputation and may indicate compromised accounts. Track separately from soft bounces (deferred).
Rejection Rate (per SMTP phase)
Connections rejected at HELO, MAIL, RCPT, or DATA. Per-phase breakdown shows which `smtpd_*_restrictions` ACL is doing the filtering work.
Postscreen Rejections
Pre-SMTP rejections from `postscreen` (DNSBL hits, pregreet, command pipelining detection). High rates = spambot blast; absent rates = postscreen not enabled or all bypassed.
SMTP Connections
Active SMTP connections to `smtpd` plus connection rate per minute. Surge = traffic spike, scan, or DoS attempt.
TLS Encryption Rate
Percentage of inbound + outbound deliveries protected with TLS. Modern target is > 95% — drops below that indicate misconfigured peers or downgrade attacks.
SMTP AUTH Failure Rate
Failed AUTH attempts on the submission port (587). Spikes = credential brute-force; pair with fail2ban rules to auto-block.
Header / Body Check Hits
Rule hit rate from `header_checks` and `body_checks`. Trending up signals new spam patterns; trending down may indicate a rule that's no longer matching.
Queue Age Distribution
From `qshape deferred` — messages by age bucket (5min, 10, 20, 40, 80, 160, 320, 640+). Old clumps = stuck deliveries needing investigation.
qmgr / cleanup / smtpd Status
Per-process health for Postfix's master daemon child processes. Restarts or crashes here signal config errors or resource exhaustion.
Configurable alert triggers
Set up custom triggers in your dashboard to get notified the moment Postfix metrics cross your defined thresholds.
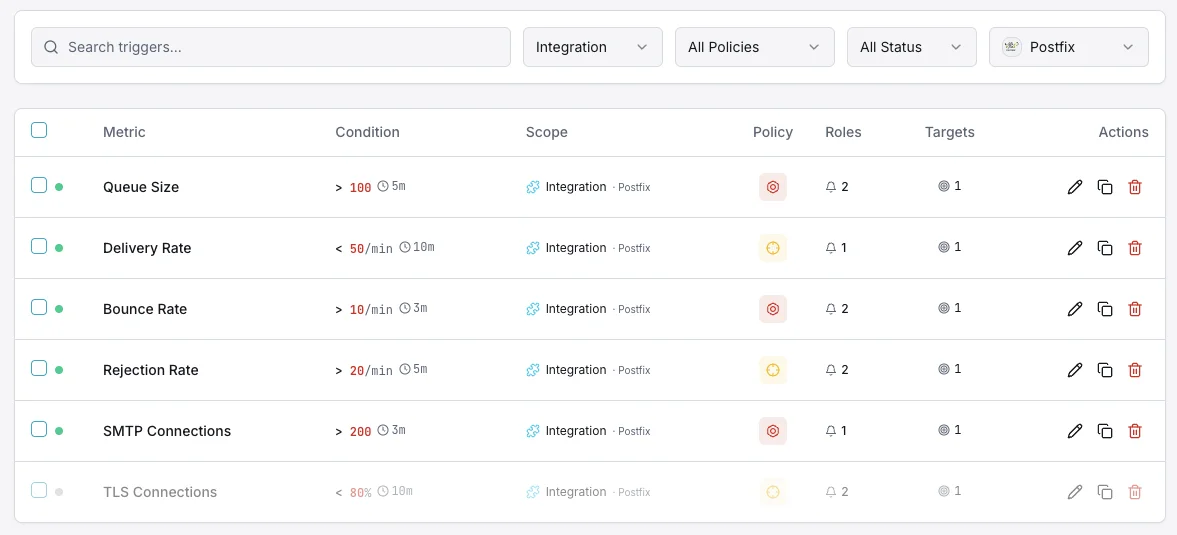
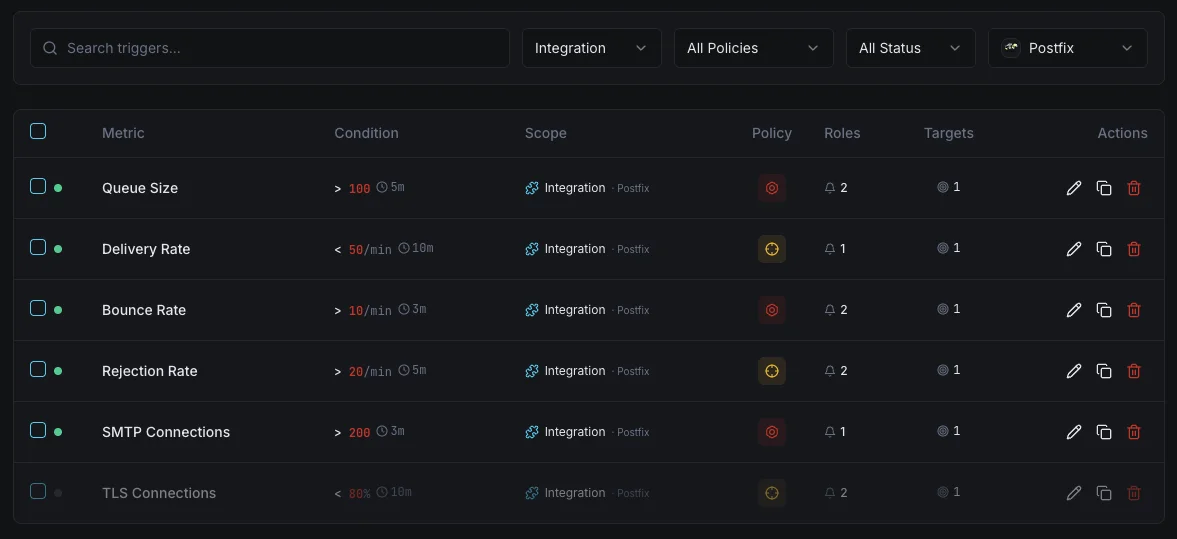
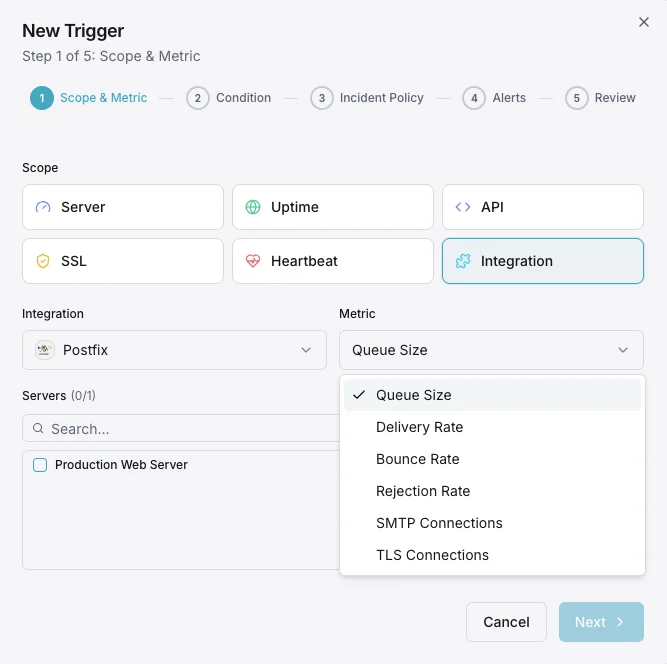
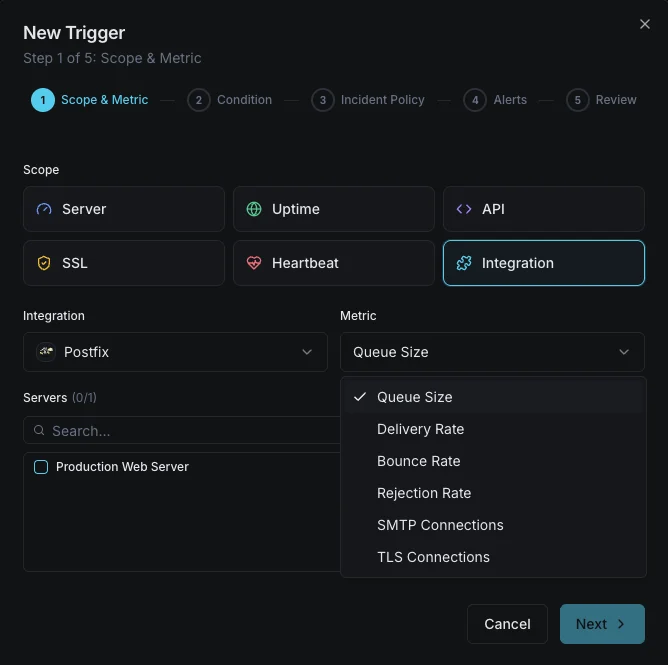
Queue Size
criticalFires when mail queue grows beyond threshold.
Bounce Rate
warningAlerts on high bounce rates.
Delivery Failures
criticalTriggers on delivery failure spikes.
Rejection Rate
warningFires on high connection rejection rate.
Importance of Postfix Monitoring
Postfix handles critical email delivery. Queue buildup, bounces, and delivery failures can mean lost communications and damaged sender reputation.
- Detect queue buildup before delivery is impacted
- Track bounce rates to maintain sender reputation
- Monitor delivery success rates
- Identify connection issues early
Why Choose Xitoring
Zero-config mail server monitoring with comprehensive queue and delivery metrics.
- One-command install
- 15+ global nodes
- Unified dashboard
- Multi-channel alerts
- Historical retention
Common Postfix monitoring scenarios
Where Postfix typically runs today — and what could go wrong if no one's watching.
Sending transactional email from a SaaS app
Password resets, receipts, and notifications need to arrive quickly and reliably. When the outbound mail layer gets stuck, those critical messages pile up — and customers never hear from you. We catch the problem the moment it begins so emails keep flowing.
Self-hosted business email server
When a company runs its own email instead of using a provider, every outage means staff can't send or receive messages. We watch the queue and the spam defenses together so problems are caught long before anyone has to ask "is the email down again?"
Newsletters and high-volume senders
Companies sending huge volumes of email live or die by their sender reputation — once it's damaged, recovery takes weeks. We track deliverability signals and flag any unusual activity so problems are spotted while there's still time to fix them.
Prerequisites for Postfix
Make sure you've got these in place — most installs are a 60-second job once they are.
- Postfix 3.7+ (3.10.x recommended) installed and running
- Read access to
/var/log/mail.log(Debian/Ubuntu) or/var/log/maillog(RHEL/Alma/Rocky) orjournalctl -u postfix postqueueandqshapebinaries on the system PATH
Get started in minutes
Install Xitogent on your mail server
Install the lightweight Xitogent monitoring agent on the host running Postfix.
curl -s https://xitoring.com/install.sh | sudo bash -s -- --key=YOUR_API_KEYConfirm log and queue access
Postfix tracks mail flow through its mail log (`/var/log/mail.log` on Debian/Ubuntu, `/var/log/maillog` on RHEL). Make sure the log is being written and that `postqueue` is on PATH for queue inspection.
sudo xitogent integrateEnable the Postfix integration
Use the Xitoring dashboard or CLI to enable the Postfix integration. Xitogent auto-detects your Postfix configuration and starts parsing queue and delivery metrics.
Configure alert thresholds (optional)
Set custom thresholds for Queue Size, Bounce Rate, or Delivery Failures to catch backpressure and reputation problems before they hit downstream senders.
Verify it's working
Run this command on the server to confirm Xitogent picked up the integration. Fresh metrics will start streaming to your dashboard within ~30 seconds.
sudo xitogent statusConsidering alternatives?
See how Xitoring stacks up against the alternatives for Postfix monitoring — flat pricing, deeper integrations, and one agent that covers your whole stack.



Frequently asked questions
What is Postfix monitoring?
How do I check the Postfix mail queue size?
How do I detect Postfix deferred queue buildup?
What does postqueue -f do?
How do I read /var/log/mail.log for Postfix errors?
How do I monitor Postfix with Prometheus / / ?
What is postscreen and how do I monitor its rejections?
How do I flush or delete deferred mail with postsuper?
What Postfix versions are supported?
Start monitoring Postfix today
Set up in under 60 seconds. No credit card required. Full metrics from day one.
Start Free Trial