In the fast-paced world of technology, efficient server monitoring is crucial for businesses to ensure optimal performance and minimize downtime. Xitoring, a leading provider of server monitoring solutions, is proud to announce the introduction of new software integrations on their flagship product, Xitogent. With seamless integration for popular software applications such as Nginx, Apache, Redis, KeyDB, PHP-FPM, MySQL, Supervisor, Docker, and Netstat, Xitoring empowers businesses to monitor their servers with ease and precision. In this blog post, we will explore the benefits of these new software integrations and how they simplify the monitoring process.
Monitoring Made Easy:
Xitoring’s Xitogent is a lightweight agent designed for Windows and Linux servers. Its primary function is to collect and transmit server data to the Xitoring platform for comprehensive monitoring. With the introduction of new software integrations, setting up monitoring for popular applications has become incredibly simple. By running a single command, “xitogent integrate,” on your Linux or Windows server, you can initiate the integration process.
Seamless Integration with Popular Software Applications:
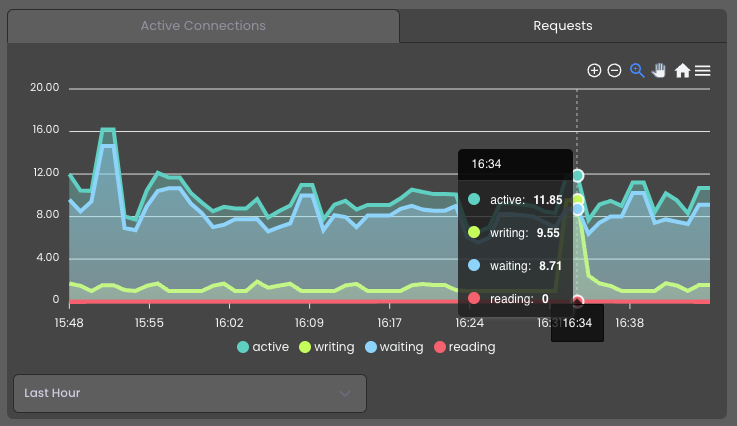
1. Nginx: Xitoring’s integration with Nginx allows you to monitor the performance and health of your Nginx web server. Track key metrics such as request rate, response time, and error rates to ensure your web server operates smoothly.
 2. Apache: Xitogent’s Apache integration provides detailed insights into your Apache web server’s performance. Monitor metrics like request handling, connection status, and resource utilization to identify bottlenecks and optimize your server configuration.
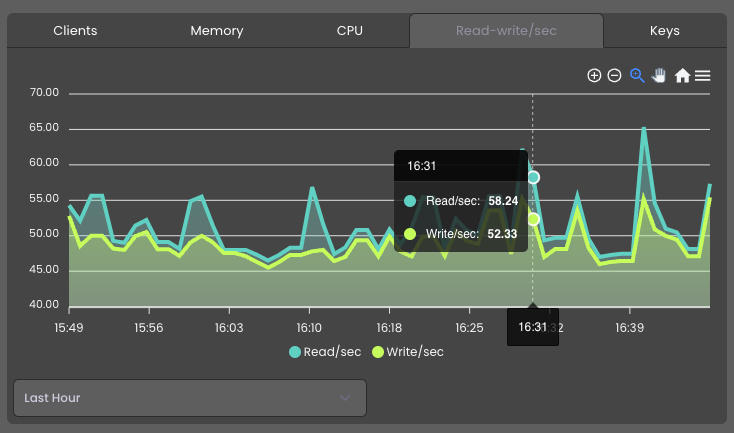
3. Redis and KeyDB: Xitoring’s integrations with Redis and KeyDB, popular in-memory databases, offer real-time monitoring of key metrics like memory usage, throughput, and latency. Stay on top of your Redis or KeyDB instances to guarantee optimal performance for your applications.
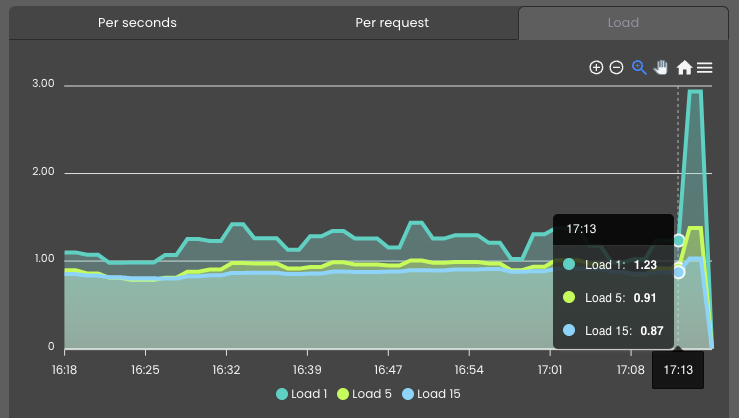
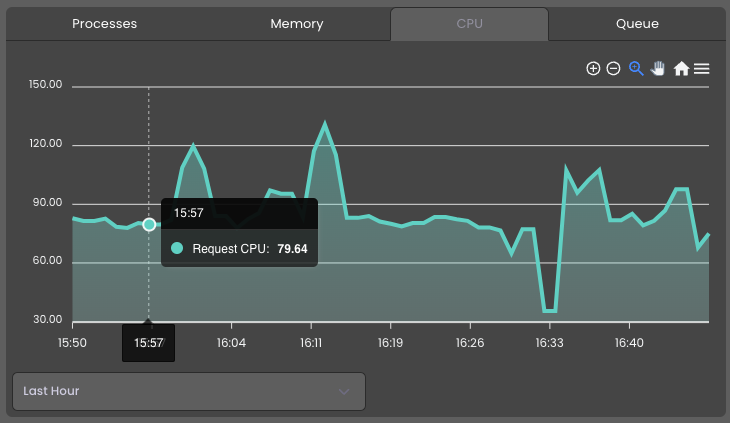
4. PHP-FPM: Xitogent’s integration with PHP-FPM allows you to monitor the performance and resource utilization of PHP FastCGI Process Manager. Keep an eye on key metrics such as request duration, active processes, and memory usage to troubleshoot issues and optimize PHP performance.
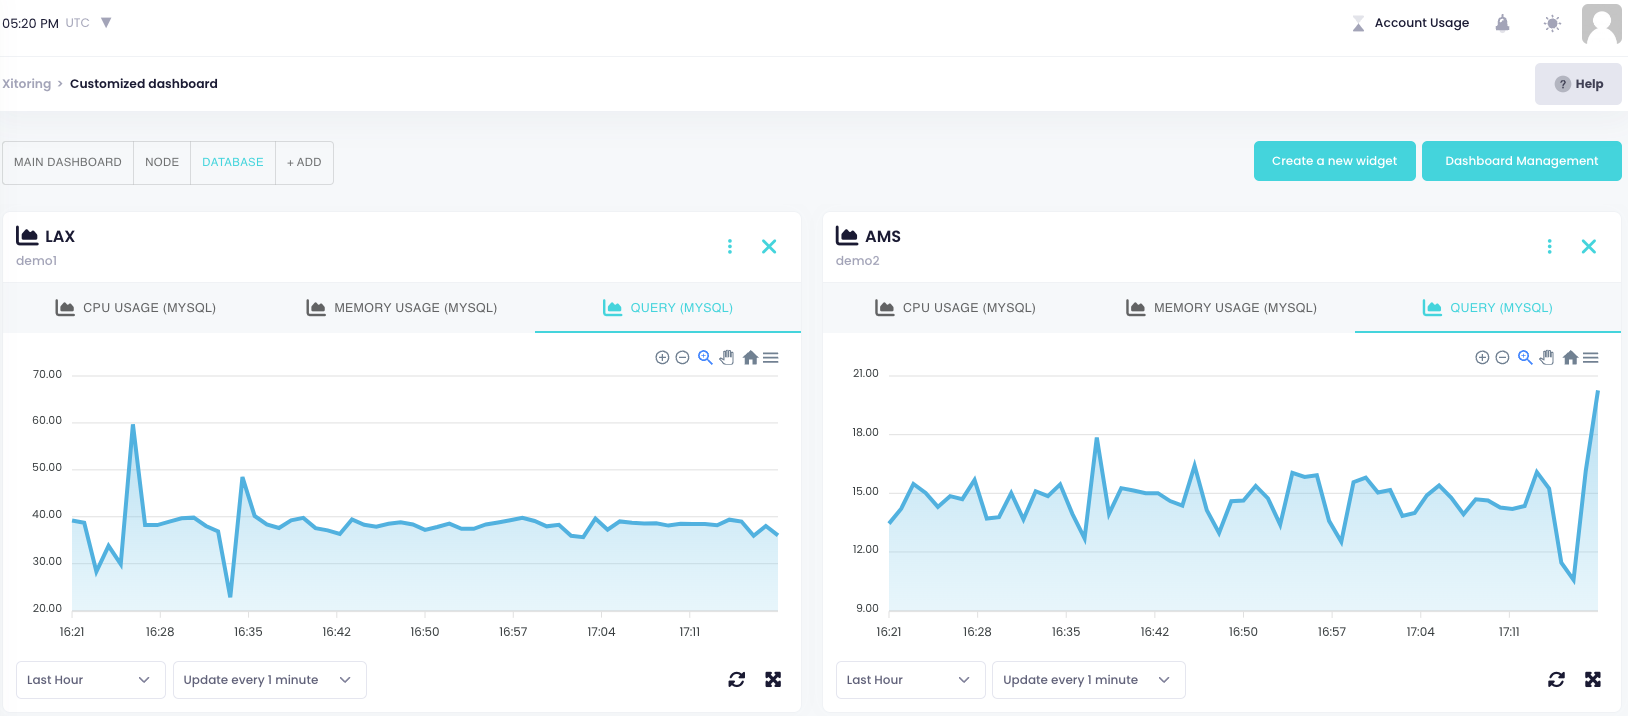
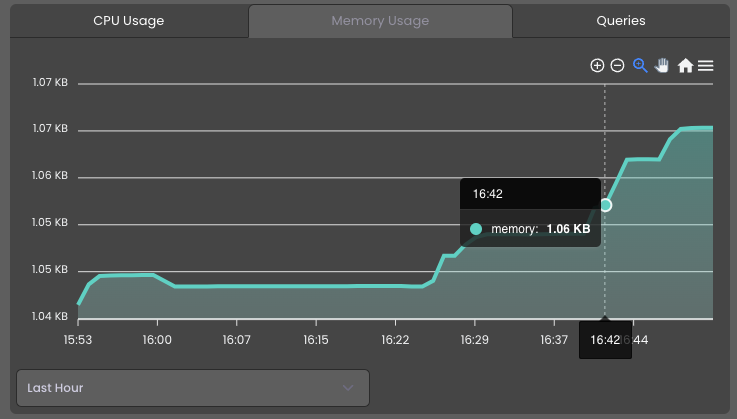
5. MySQL: Xitoring’s integration with MySQL enables comprehensive monitoring of your MySQL databases. Monitor critical metrics like query execution time, connection status, and replication lag to ensure the stability and performance of your database environment.
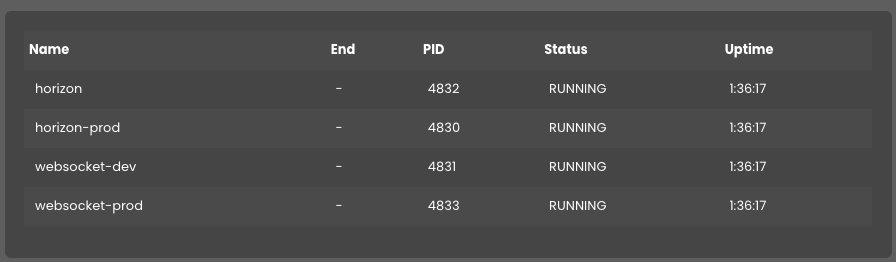
6. Supervisor: Xitogent’s integration with Supervisor offers a convenient way to monitor and manage processes running on your servers. Gain visibility into process status, resource usage, and restart counts to proactively address any issues.
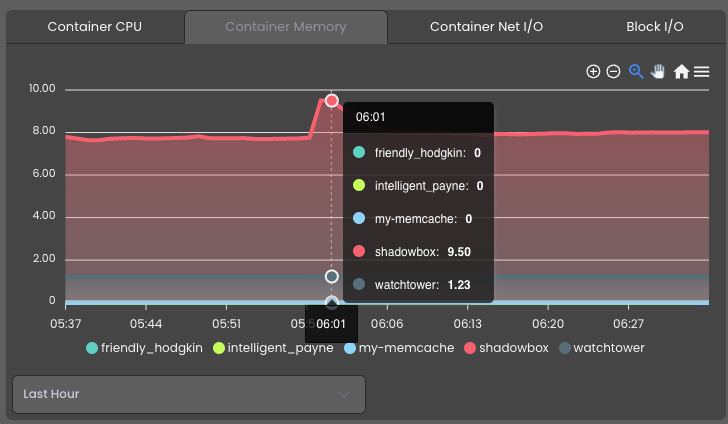
7. Docker: Xitoring’s Docker integration provides monitoring capabilities for Docker containers. Monitor container health, resource utilization, and network statistics to ensure your Dockerized applications run smoothly.
8. Netstat: Xitogent’s integration with Netstat gives you insights into network connections and traffic on your servers. Monitor active connections, connection states, and network throughput to detect any abnormalities or potential security threats.
Proactive Alerting and Reporting:
Xitoring goes beyond just data collection. With the new software integrations, Xitogent enables proactive alerting to keep you informed when something goes wrong. Based on the defined thresholds and rules, Xitoring generates alerts and sends email notifications, ensuring that you can address issues promptly and minimize any potential downtime.
Conclusion:
With the introduction of new software integrations on Xitogent, Xitoring has taken server monitoring to the next level. Simplify your monitoring workflow with a single command and gain valuable insights into the performance and health of your Nginx, Apache, Redis, KeyDB, PHP-FPM, MySQL,
We are dedicated to providing our users with a seamless monitoring experience, and we value their feedback and suggestions. If you have any specific software integration requests or would like to see additional integrations on Xitogent, we encourage you to contact us. Our team is always ready to listen to your needs and explore ways to enhance our product to meet your requirements.
Furthermore, we understand that technology is constantly evolving, and new software applications emerge regularly. Rest assured that our team is diligently working on expanding our list of integrations to accommodate a wider range of technologies. We are committed to staying at the forefront of server monitoring solutions and will continue to add new integrations to Xitogent in the near future.
At Xitoring, our goal is to empower businesses with robust and user-friendly monitoring tools. With our new software integrations and a dedication to continuous improvement, we strive to provide you with the most comprehensive and efficient server monitoring solution available. Contact us today to discover how Xitogent can revolutionize your server monitoring experience.