Apache Monitoring
Monitor Apache HTTP Server requests/sec, BusyWorkers vs IdleWorkers, BytesPerSec, async connection states, and CPULoad in real time — agent-based via `mod_status` and `?auto`.
Why monitor Apache?
Apache HTTP Server still runs a huge slice of the web — cPanel/WHM hosting, WordPress, Drupal, and CDN origins. When workers saturate, CPU spikes, or one noisy vhost starts consuming the pool, every site on the box slows down. Monitoring surfaces the offender before you have to ssh in at 3am.
Apache monitoring, explained
Apache monitoring catches worker-pool saturation, CPU spikes, and slow-response patterns before they cascade into 503s. On shared cPanel/WHM hosting or any multi-vhost setup, it's also how you find the one noisy account consuming workers from everyone else — without sshing into the box at 3am. Xitoring auto-discovers your Apache, polls /server-status?auto on a 1-minute interval, and routes alerts to Slack, PagerDuty, Telegram, or whatever your team already uses.
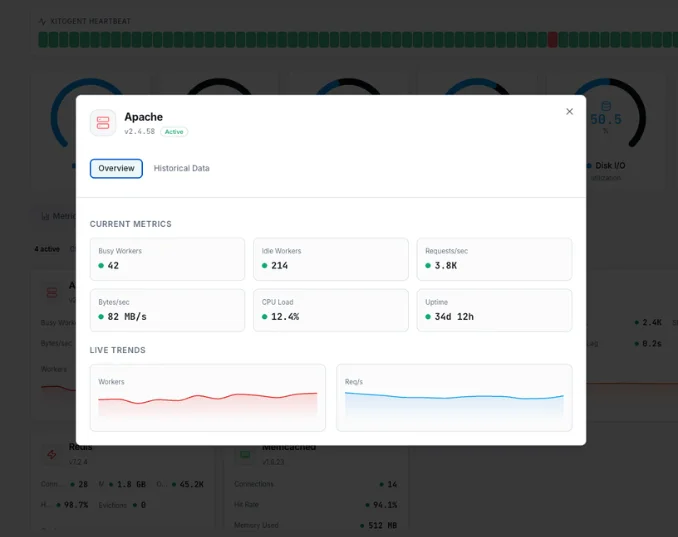
What we monitor
Total Requests
Total number of HTTP requests processed since the server started.
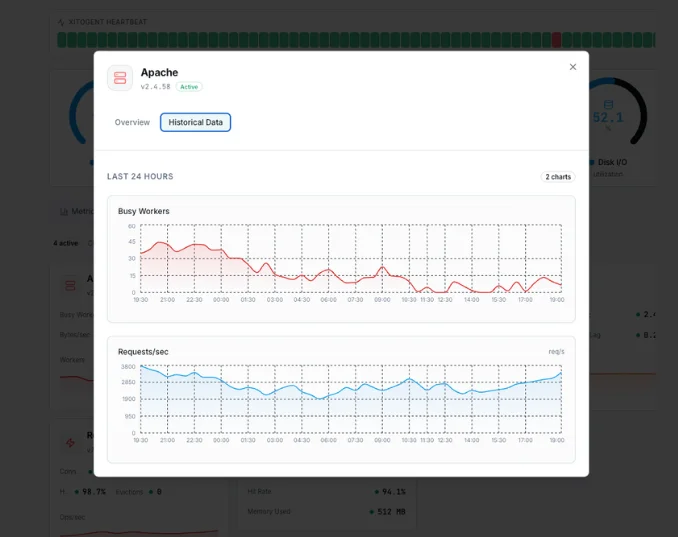
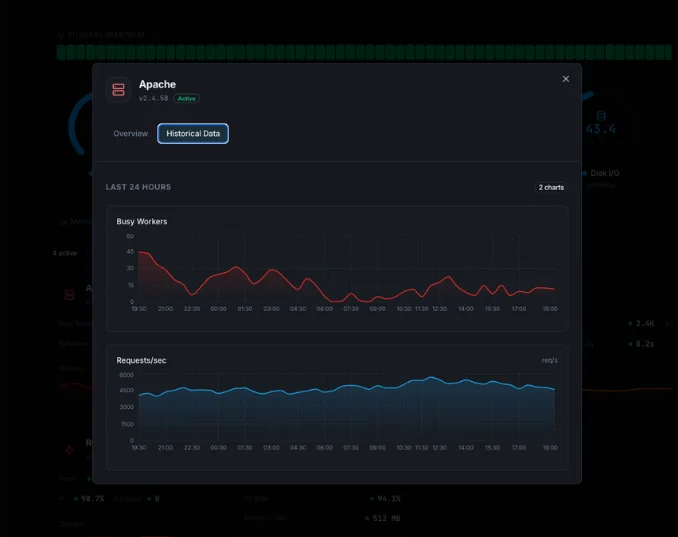
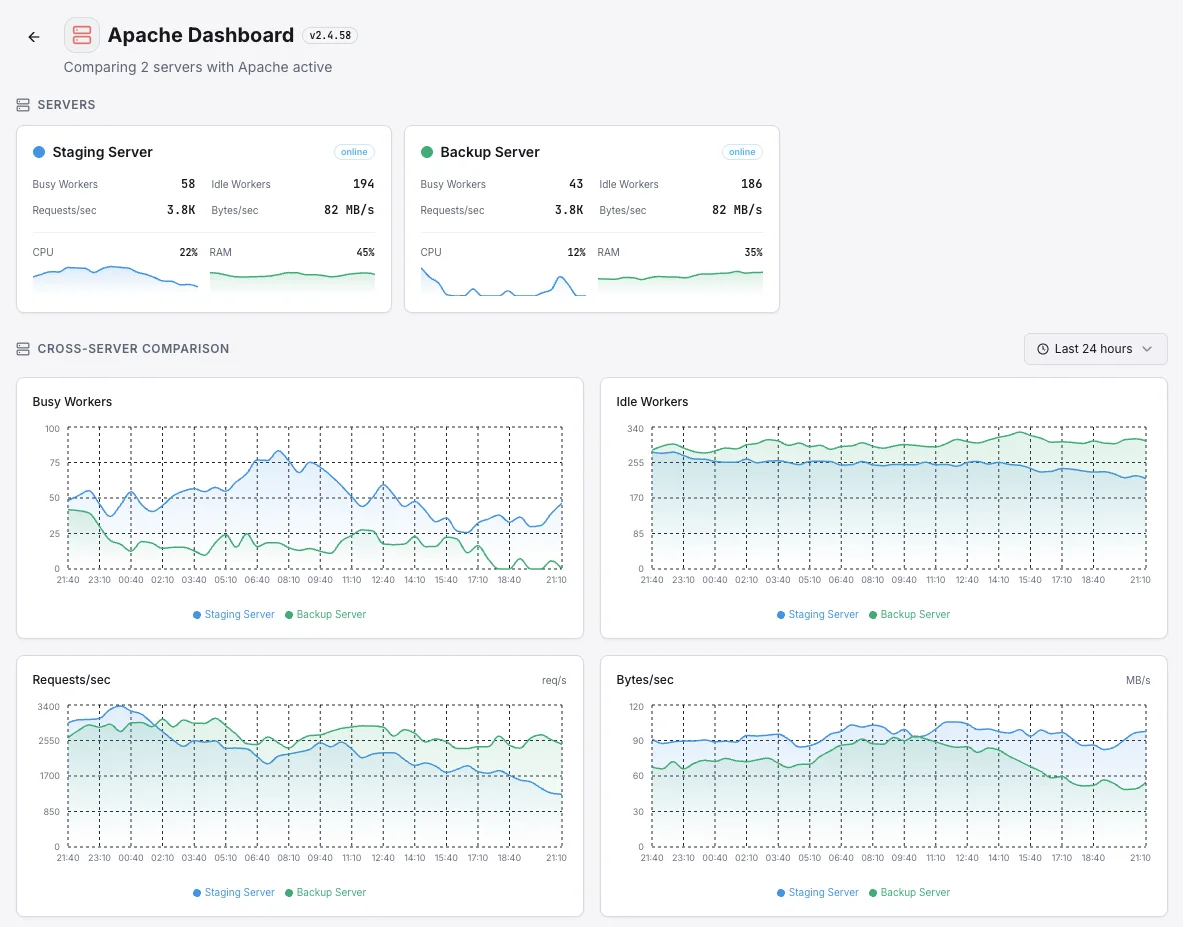
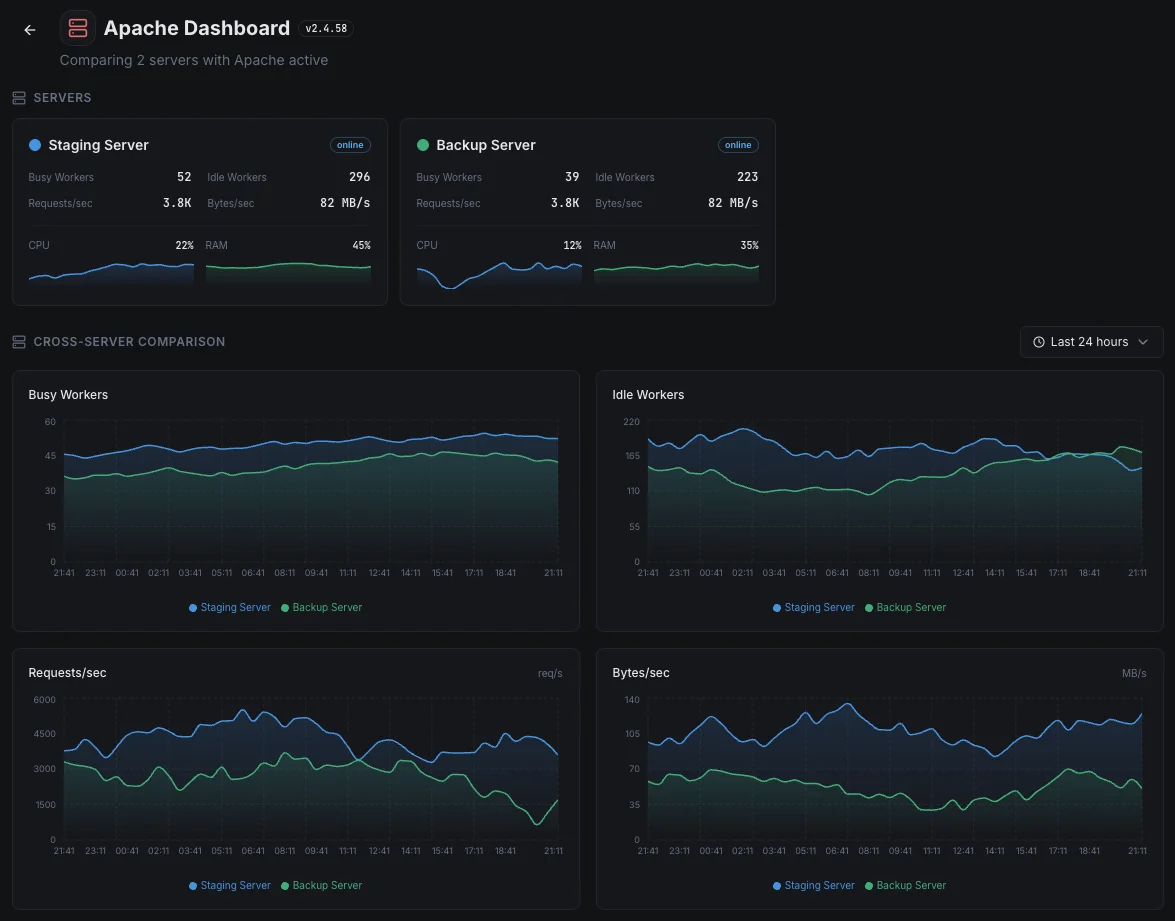
Requests per Second
Current rate of incoming HTTP requests hitting your server.
Bytes per Second
Data throughput rate measuring how much data Apache is serving.
Bytes per Request
Average response size per request, useful for detecting payload anomalies.
Busy Workers
Number of worker threads actively processing requests.
Idle Workers
Number of worker threads waiting for incoming requests.
Connections Total
Total number of connections accepted by the server.
Connections Async Writing
Connections in async write state, waiting to send data to clients.
Connections Async Keep-Alive
Connections held open in keep-alive state for potential reuse.
Connections Async Closing
Connections in the process of being gracefully closed.
Server Uptime
Total time the Apache server has been running without restart.
CPU Load
Percentage of CPU consumed by Apache worker processes.
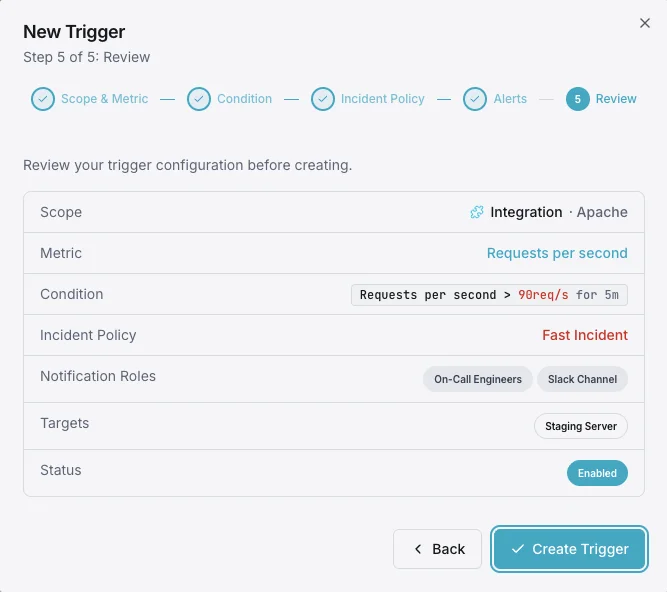
Configurable alert triggers
Set up custom triggers in your dashboard to get notified the moment Apache metrics cross your defined thresholds.
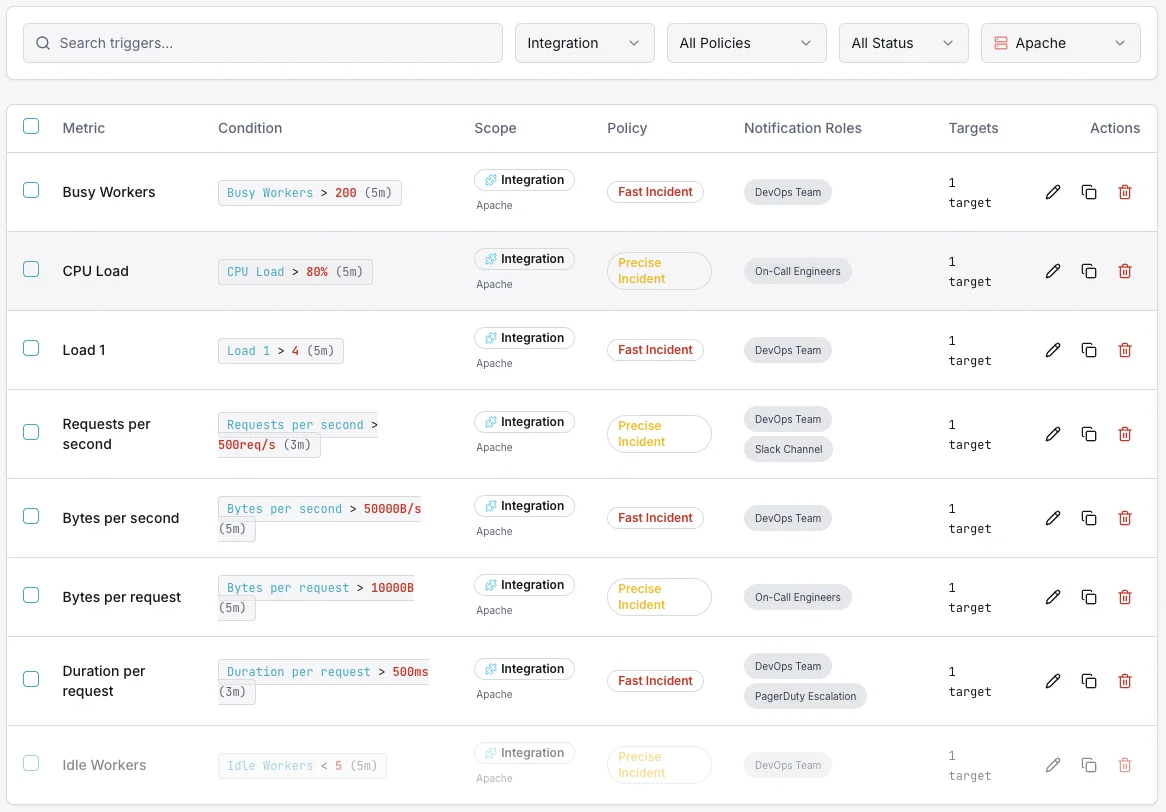
Busy Workers
warningFires when the number of active worker threads exceeds your threshold, indicating the server is under heavy load and may start queuing requests.
Idle Workers
criticalTriggers when idle workers drop below a minimum, meaning the server has little spare capacity to handle incoming traffic spikes.
Requests per Second
warningAlerts when the request rate exceeds normal baselines, useful for detecting traffic surges, DDoS patterns, or runaway bots.
CPU Load
criticalFires when Apache's CPU consumption crosses your defined limit, signaling resource contention that could degrade response times.
Bytes per Second
warningTriggers on abnormal throughput — either unusually high (possible data exfiltration) or low (upstream issues).
Server Uptime Reset
criticalDetects when the server uptime counter resets to zero, indicating an unexpected Apache restart or crash event.
Importance of Apache Monitoring
Apache powers over 30% of all active websites globally. Without proper monitoring, performance degradation, traffic spikes, and resource exhaustion can go undetected — leading to downtime, lost revenue, and poor user experience.
- Detect slow response times before they impact end users
- Identify memory leaks and resource exhaustion early
- Prevent cascading failures across your infrastructure
- Maintain SLA compliance with real-time visibility
- Correlate Apache metrics with upstream application performance
Why Choose Xitoring
Xitoring delivers enterprise-grade Apache monitoring with zero-config setup. Our lightweight agent auto-discovers your Apache instances, starts collecting metrics in under 60 seconds, and integrates with your existing notification channels.
- One-command install — no complex YAML or config files
- 15+ global monitoring nodes for low-latency checks
- Unified dashboard for servers, services, and uptime
- Flexible alerting via Slack, PagerDuty, Telegram & more
- Historical data retention for capacity planning & audits
Common Apache monitoring scenarios
Where Apache typically runs today — and what could go wrong if no one's watching.
Busy WordPress or eCommerce hosting
When dozens of websites share the same server — the usual setup for hosting companies and agencies — one noisy site can starve every other site on the box. We catch the early warning signs so the team can act before customers ever see a slow or broken page.
Website behind a CDN like Cloudflare
A CDN absorbs traffic spikes, but the original web server still has to be healthy — and CDN dashboards don't tell you when it isn't. We watch the source-of-truth signals from your own server so a quiet origin slowdown can't degrade the whole site.
Web server passing traffic to apps behind it
When Apache hands requests off to an internal application, the slow piece is usually that app — not Apache itself. We separate the two so you instantly know whether to investigate the web layer or the app behind it, instead of chasing the wrong thing during an incident.
Prerequisites for Apache
Make sure you've got these in place — most installs are a 60-second job once they are.
- Apache 2.4 or later (2.5/trunk also supported) running on the server
mod_statusenabled withExtendedStatus Onand the/server-status?autoendpoint reachable from localhost- sudo / root access to install Xitogent and read the Apache config
Get started in minutes
Install Xitogent on your server
If you haven't already, install the lightweight Xitogent monitoring agent on your server.
curl -s https://xitoring.com/install.sh | sudo bash -s -- --key=YOUR_API_KEYEnable mod_status in Apache
Ensure mod_status is enabled and accessible locally. Add the following to your Apache configuration:
<Location "/server-status">
    SetHandler server-status
    Require local
</Location>Enable the Apache integration
Use the Xitoring dashboard or CLI to enable the Apache integration. Xitogent will auto-detect your Apache instance.
sudo xitogent integrateConfigure alert thresholds (optional)
Set custom thresholds for metrics like busy workers, request rate, or CPU load to get notified when something needs attention.
Verify it's working
Run this command on the server to confirm Xitogent picked up the integration. Fresh metrics will start streaming to your dashboard within ~30 seconds.
sudo xitogent statusConsidering alternatives?
See how Xitoring stacks up against the alternatives for Apache monitoring — flat pricing, deeper integrations, and one agent that covers your whole stack.


Frequently asked questions
What is Apache monitoring?
How do I enable mod_status in Apache?
What is the difference between mod_status and ExtendedStatus?
How do I monitor Apache prefork vs worker vs event MPM?
How do I access server-status in machine-readable format?
How do I log real client IPs when Apache is behind a CDN?
Will this integration affect Apache performance?
Can I monitor multiple Apache instances on one server?
What Apache versions are supported?
Start monitoring Apache today
Set up in under 60 seconds. No credit card required. Full metrics from day one.
Start Free Trial