Docker Monitoring
Monitor Docker container CPU %, memory (excluding cache), network I/O, blkio, restart counts, OOM kills, and `HEALTHCHECK` status per container in real time — via the Docker Engine API and cgroup v2.
Why monitor Docker?
Docker is the standard container runtime for local dev, single-host production, and edge deployments. Containers OOM-kill silently, restart in loops, and consume runaway memory or CPU without warning. Per-container monitoring is the difference between 'my site is slow' and 'the cache container has been OOM-killed 47 times in the last hour.'
Docker monitoring, explained
Docker monitoring catches container OOM kills, CPU throttling, crash loops, runaway resource usage, and failed HEALTHCHECK probes before they cascade into user-visible outages. For single-host production (the dominant non-Kubernetes deployment in 2026), Docker Compose stacks, Swarm clusters, and edge/Raspberry Pi setups, per-container visibility is what separates "my site is slow" from "the cache container has been OOM-killed 47 times in the last hour." Xitoring auto-discovers every container, reads the Docker API + cgroup v2 directly, and routes alerts to Slack, PagerDuty, Telegram, or your existing on-call.
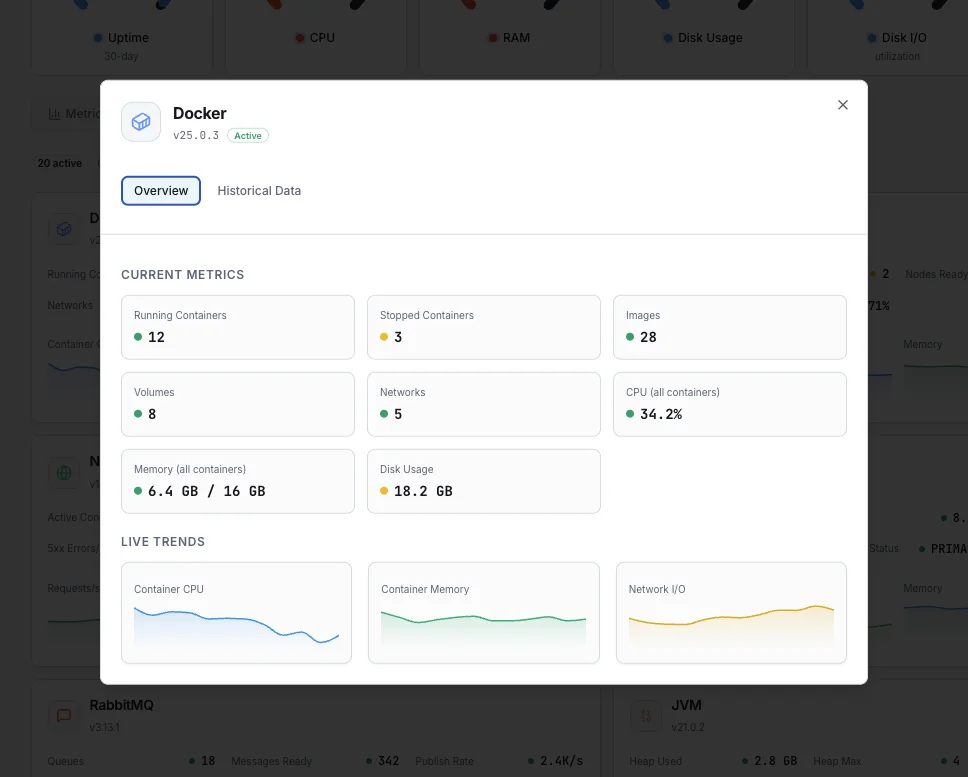
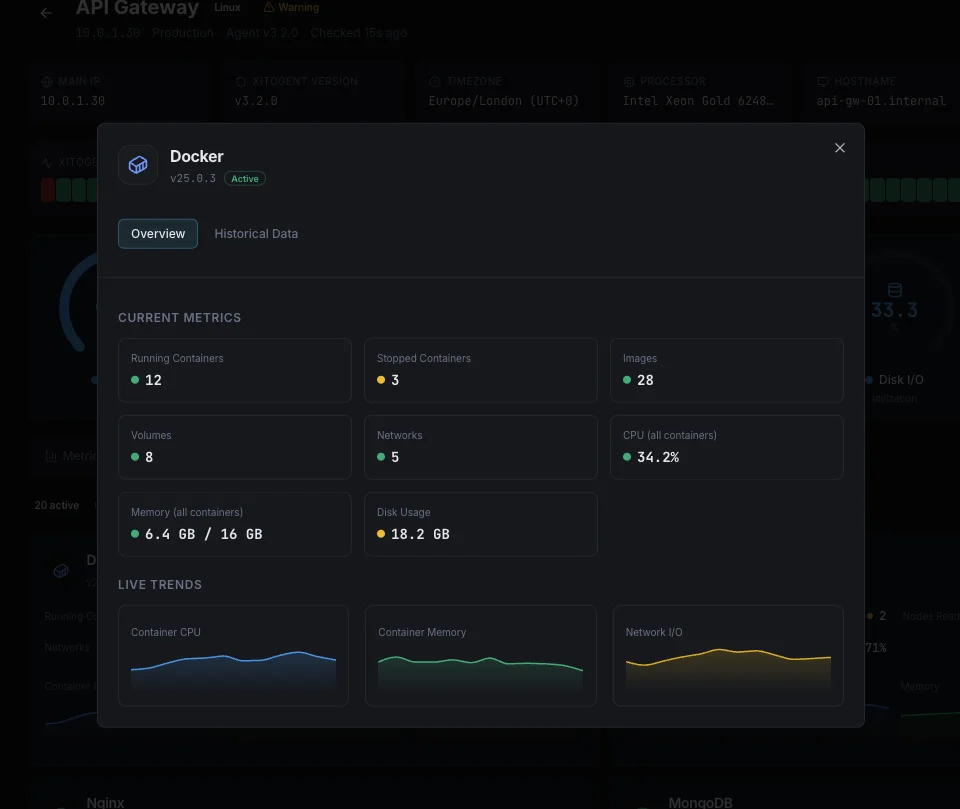
What we monitor
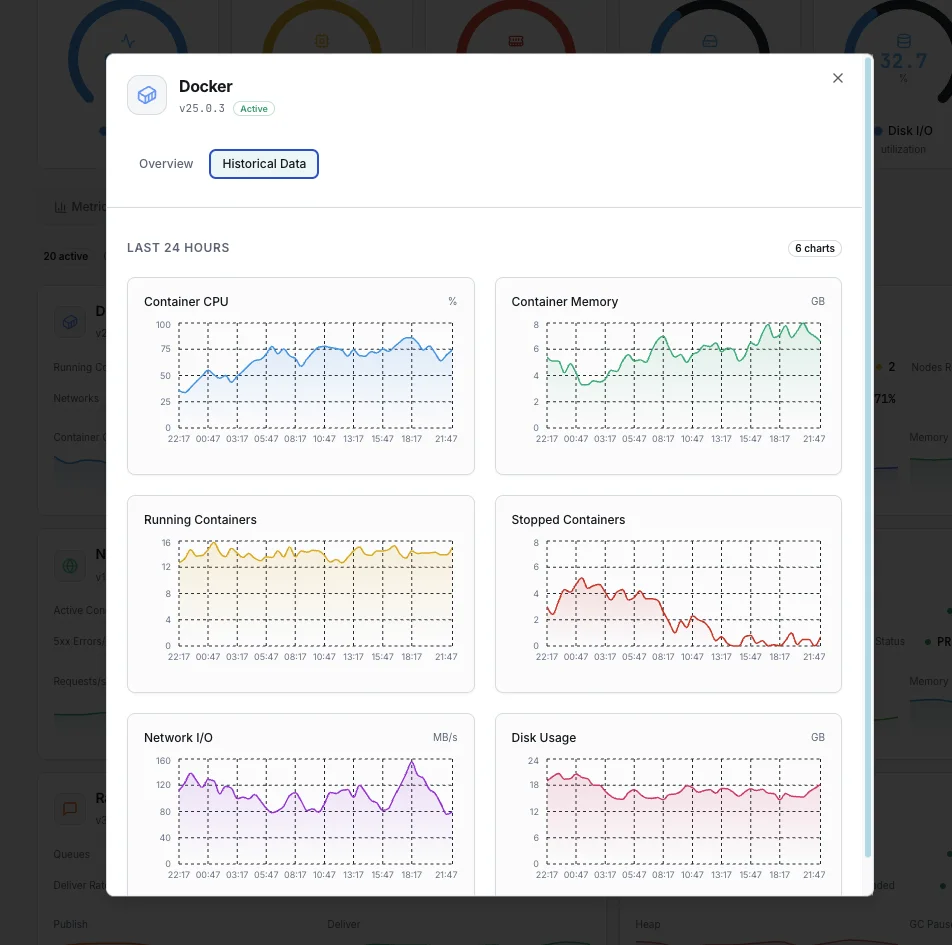
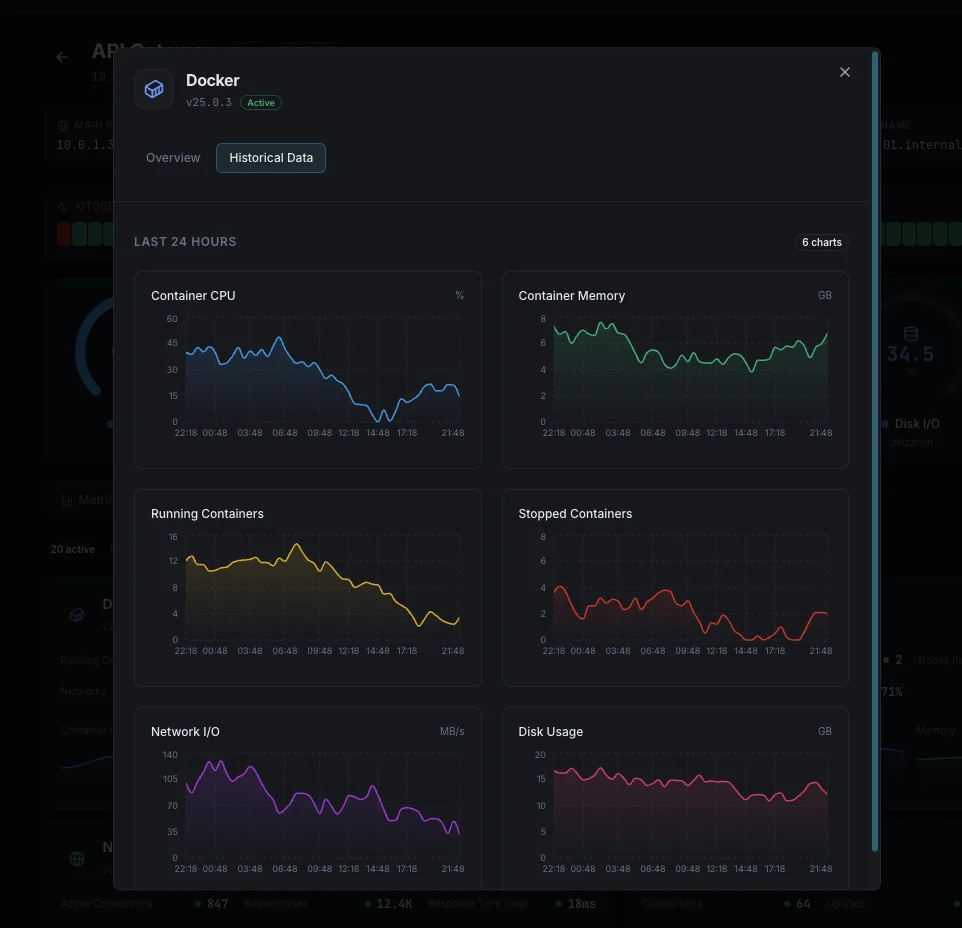
Container CPU Usage
CPU utilization percentage for each running container.
Container Memory Usage
Memory consumed by each container vs its memory limit.
Memory Limit
Configured memory limit and current usage percentage for each container.
Network RX/TX
Incoming and outgoing network traffic per container.
Block I/O Read/Write
Disk read and write operations per container.
Container Count
Total number of running, stopped, and paused containers.
Container Restarts
Number of restart events per container, indicating stability issues.
Container Health
Health check status for containers with configured HEALTHCHECK.
PIDs
Number of processes running inside each container.
Container Uptime
How long each container has been running since last start.
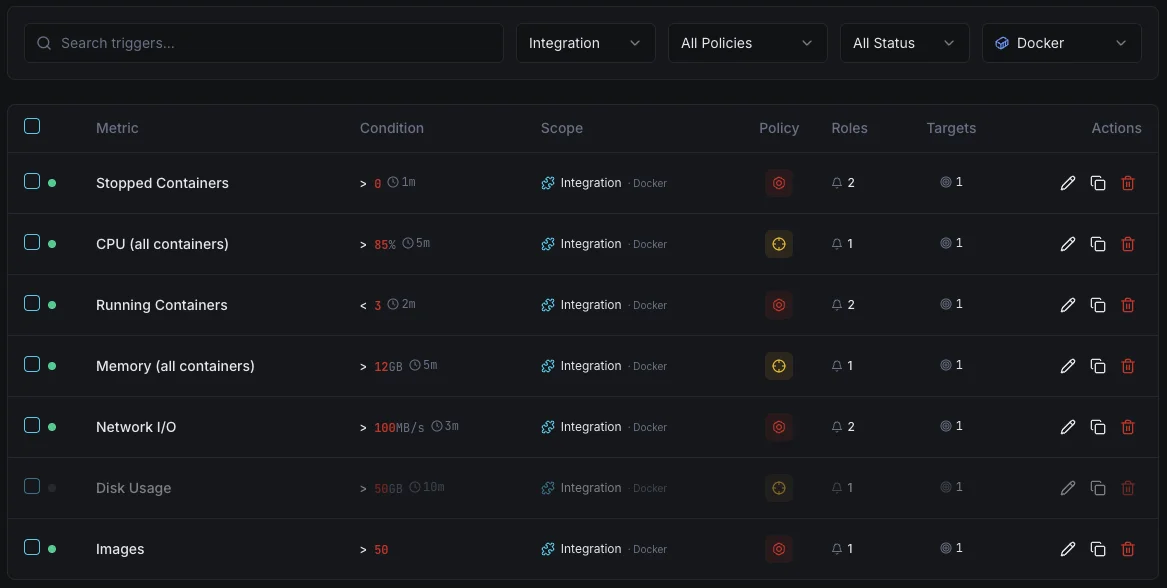
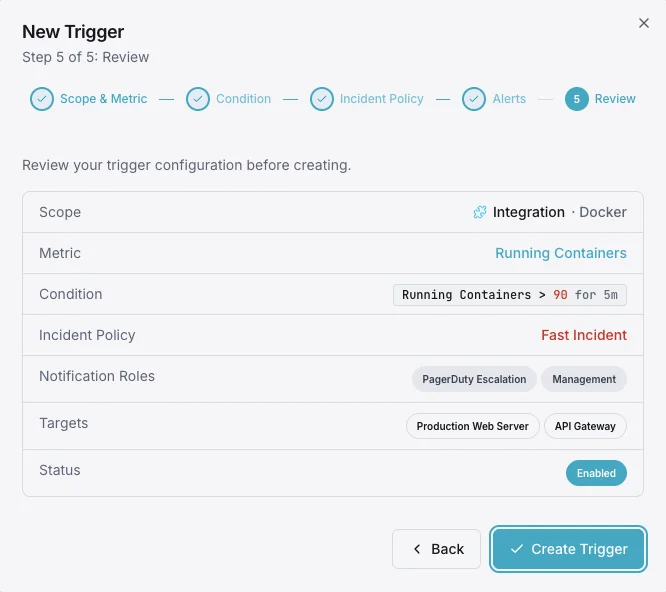
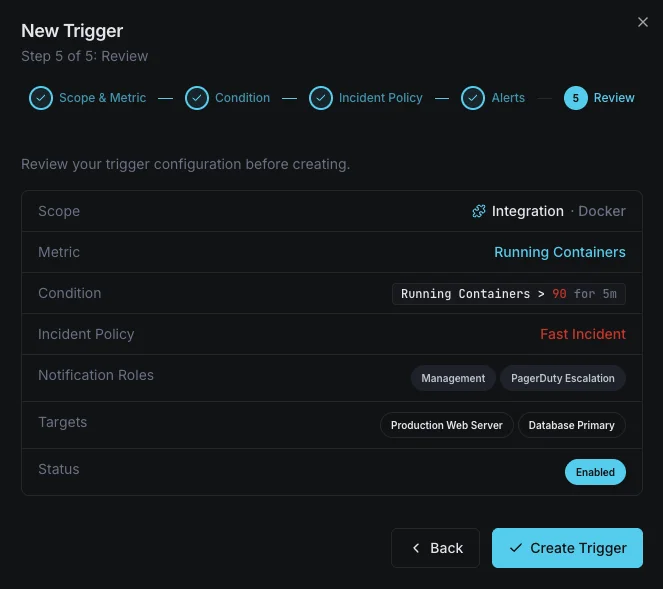
Configurable alert triggers
Set up custom triggers in your dashboard to get notified the moment Docker metrics cross your defined thresholds.
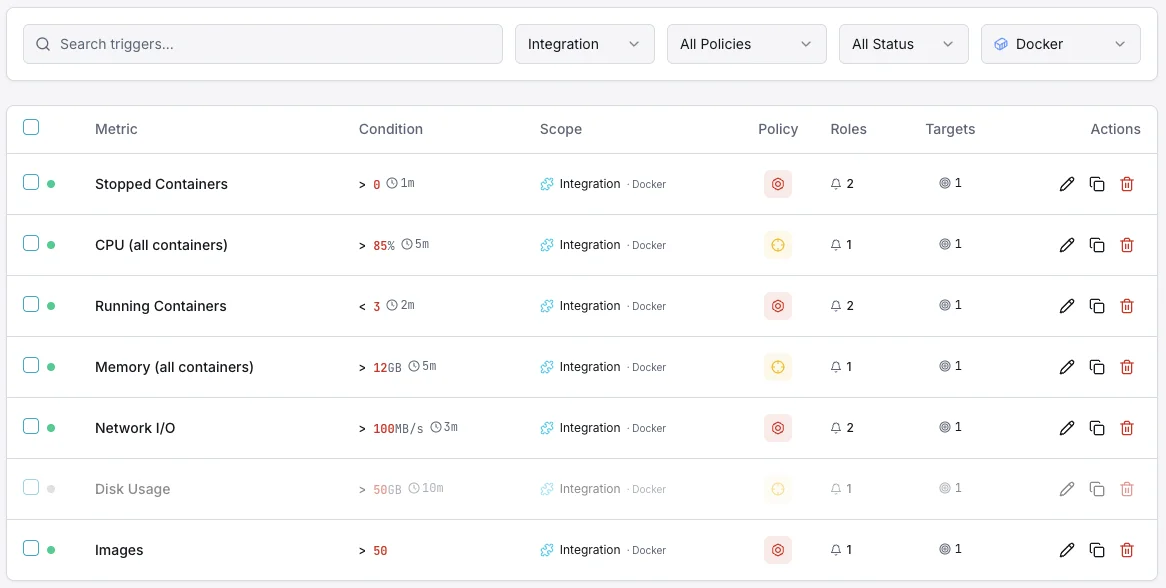
Container CPU Usage
warningFires when a container's CPU usage exceeds your threshold, indicating resource contention or runaway processes.
Container Memory Usage
criticalTriggers when memory approaches the container limit, risking OOM kills and container crashes.
Container Restarts
criticalAlerts when a container exceeds your restart count threshold, indicating instability or crash loops.
Container Health
criticalFires when a container's HEALTHCHECK reports unhealthy status.
Network I/O Spike
warningTriggers on abnormal network traffic patterns, which may indicate data exfiltration or DDoS.
Container Stopped
criticalAlerts when an expected container stops running unexpectedly.
Importance of Docker Monitoring
Docker containers are ephemeral by nature — they can crash, restart, and consume unbounded resources without warning. Without monitoring, memory leaks, CPU throttling, and crash loops can silently degrade your entire infrastructure.
- Detect memory leaks before containers hit OOM limits
- Identify crash loops and unstable containers immediately
- Monitor resource allocation vs actual usage per container
- Track network I/O for security and performance analysis
- Ensure container health checks are passing consistently
Why Choose Xitoring
Xitoring delivers enterprise-grade Docker monitoring with zero-config setup. Our lightweight agent auto-discovers all containers on your host, starts collecting metrics in under 60 seconds, and integrates with your existing notification channels.
- One-command install — no sidecar containers needed
- 15+ global monitoring nodes for low-latency checks
- Unified dashboard for hosts, containers, and services
- Flexible alerting via Slack, PagerDuty, Telegram & more
- Historical data retention for capacity planning & audits
Common Docker monitoring scenarios
Where Docker typically runs today — and what could go wrong if no one's watching.
Small production app on a single server
Many SaaS products, internal tools, and side projects run as a handful of containers on a single cloud server. One misbehaving container can quietly drag down everything else on the box — we catch that before your users do, so a single bad release can't take the whole product offline.
Apps on edge or low-power hardware
Mini-PCs and small devices running smart-home, retail, or field equipment work under tight resource limits. We watch for the warning signs of CPU, memory, and storage stress so the team can step in before a struggling device silently fails on-site.
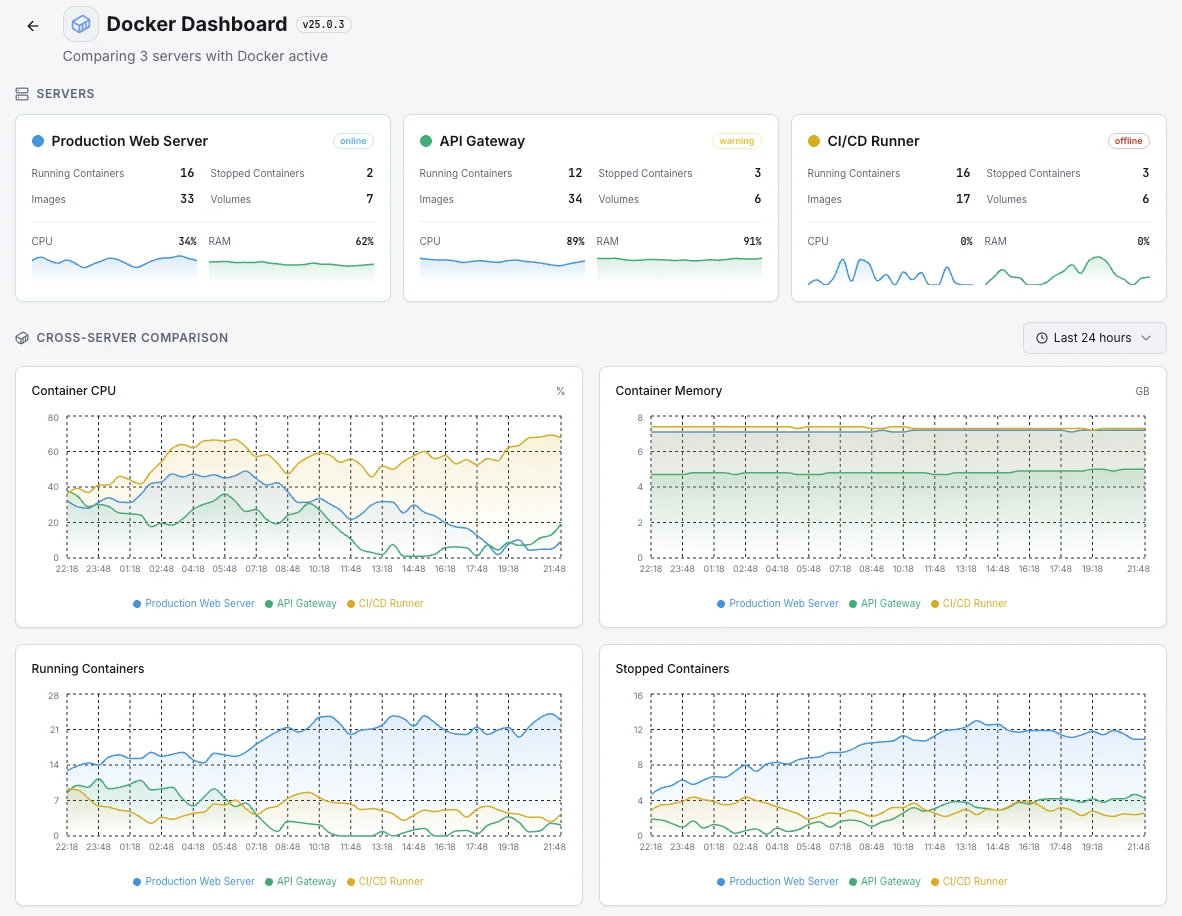
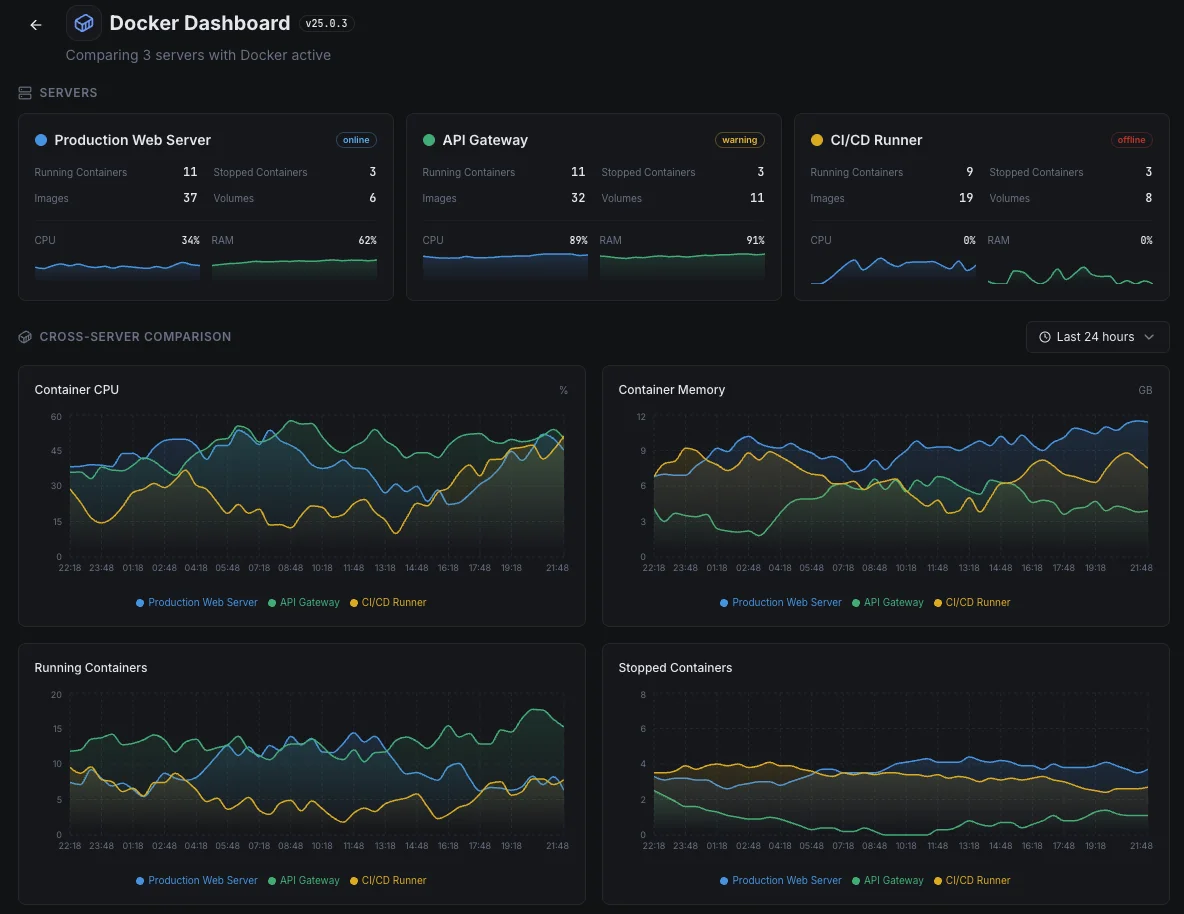
Container clusters across multiple servers
When containers are spread across many machines, it's easy for some servers to do all the work while others sit idle — wasting capacity and risking overload. We give you one plain view of how the work is distributed so the load can be rebalanced before anything breaks.
Prerequisites for Docker
Make sure you've got these in place — most installs are a 60-second job once they are.
- Docker Engine 20.10+ (25.x / 26.x / 27.x recommended) running on the host
/var/run/docker.sockpresent (default Linux installation; rootless mode socket also supported)- Network reachability between Xitogent and the Docker daemon
Get started in minutes
Install Xitogent on your Docker host
Install the lightweight Xitogent monitoring agent on the host machine running Docker. Xitogent runs as a root system service, so it already has access to the Docker socket — no extra permissions are needed.
curl -s https://xitoring.com/install.sh | sudo bash -s -- --key=YOUR_API_KEYConfirm Docker is running
Make sure the Docker daemon is reachable. A quick `docker ps` on the host confirms the engine is up and the socket is responsive before you wire up the integration.
docker psEnable the Docker integration
Run `sudo xitogent integrate` and select Docker. Xitogent will auto-discover all running containers and start tracking them.
sudo xitogent integrateConfigure alert thresholds (optional)
Set custom thresholds for container CPU, memory, restart counts, or health status to get notified when something needs attention.
Verify it's working
Run this command on the server to confirm Xitogent picked up the integration. Fresh metrics will start streaming to your dashboard within ~30 seconds.
sudo xitogent statusConsidering alternatives?
See how Xitoring stacks up against the alternatives for Docker monitoring — flat pricing, deeper integrations, and one agent that covers your whole stack.


Frequently asked questions
What is Docker monitoring?
How do I monitor CPU usage per Docker container?
How do I monitor Docker memory usage including cache?
How do I detect Docker container restarts?
How do I detect container OOM kills?
What is cAdvisor and how does it monitor containers?
How do I monitor Docker network I/O per container?
Does this work with Docker Compose / Swarm / Podman?
How often are metrics collected?
Start monitoring Docker today
Set up in under 60 seconds. No credit card required. Full metrics from day one.
Start Free TrialKeep exploring