Apache Kafka Monitoring
Monitor Apache Kafka UnderReplicatedPartitions, OfflinePartitionsCount, ActiveControllerCount, consumer group lag, ISR shrinks/expands, and tiered-storage segment metrics in real time — via JMX or the OpenTelemetry Kafka receiver.
Why monitor Apache Kafka?
Kafka is the event-streaming backbone for CDC pipelines, microservice eventing, and high-throughput data infrastructure. Under-replicated partitions, offline partitions, consumer-group lag, and controller failures cause data loss or downstream microservice cascades — and they're invisible without dedicated monitoring. Catching them at minute resolution is the difference between a clean recovery and a multi-day outage.
Kafka monitoring, explained
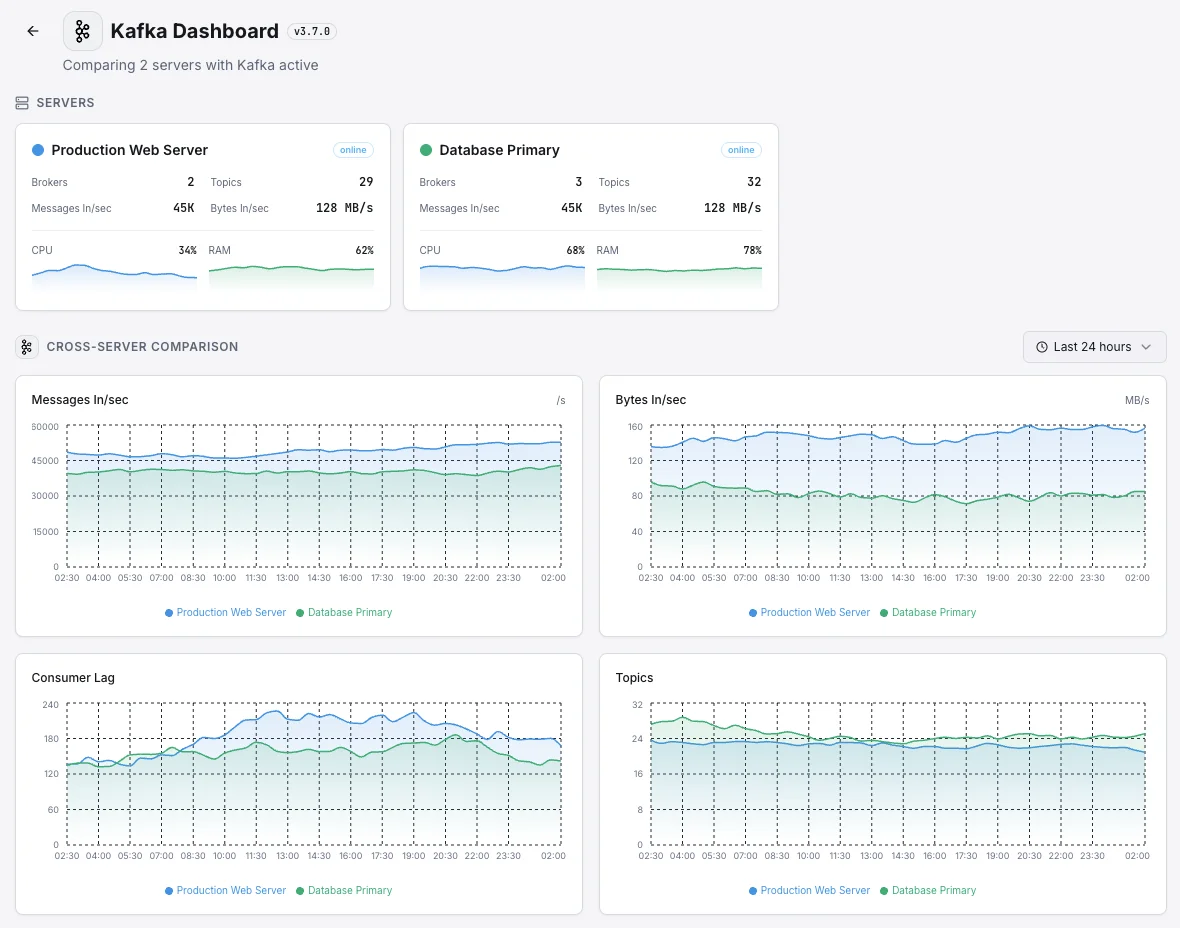
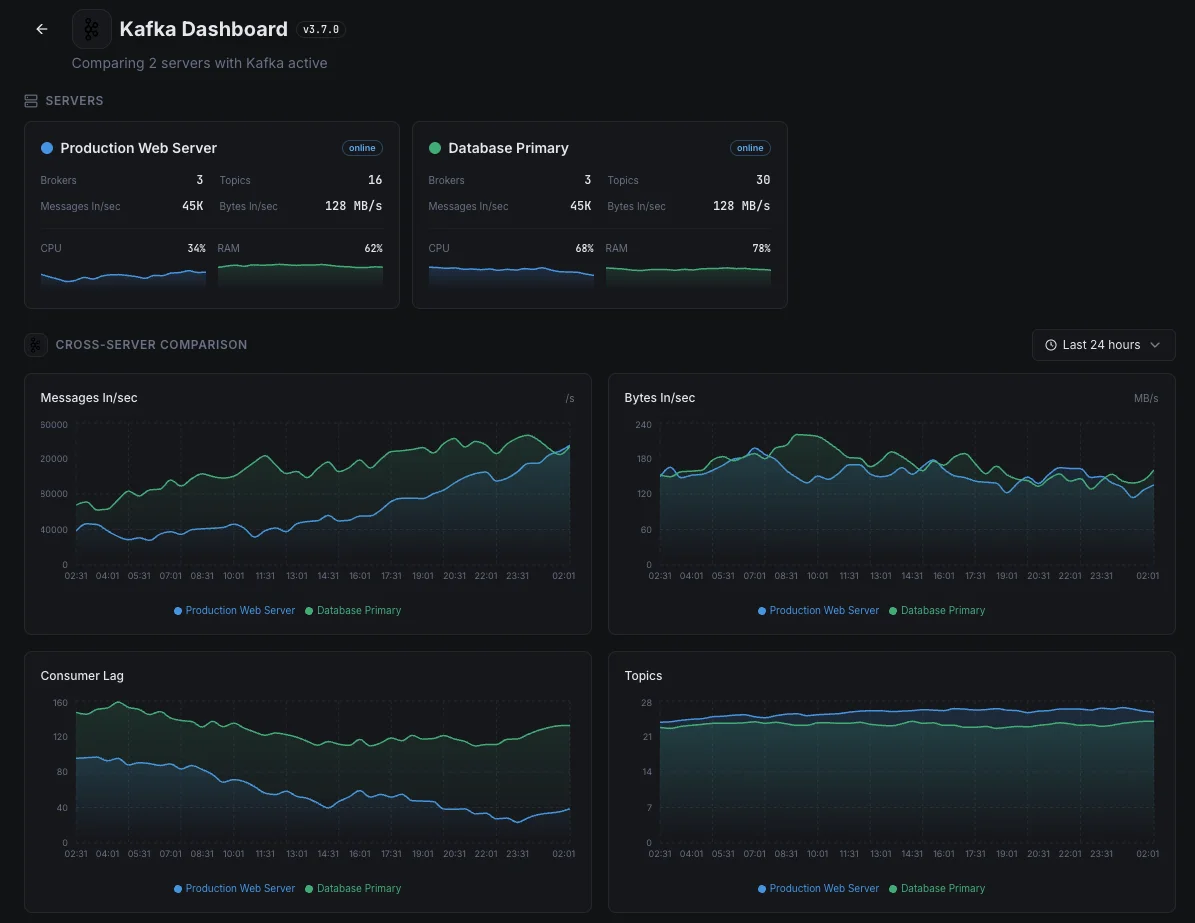
Kafka monitoring catches under-replicated partitions, offline partitions, consumer-group lag spikes, ISR shrinks, controller failures, and disk pressure before they cause data loss, downstream microservice failures, or full broker outages. For CDC pipelines, event-sourcing systems, microservice eventing, and any production Kafka cluster, per-broker + per-consumer-group visibility is what separates a 60-second alert on a lagging consumer from finding a 50-million-message backlog at end-of-day. Xitoring auto-discovers your brokers, reads JMX MBeans + consumer offsets, and routes alerts to Slack, PagerDuty, Telegram, or your existing on-call.
What we monitor
UnderReplicatedPartitions
Partitions where ISR (in-sync replicas) < replication factor. Any sustained non-zero value = a broker is lagging, restarting, or dead. The single most important Kafka cluster-health alert.
UnderMinIsrPartitionCount
Partitions with ISR below `min.insync.replicas`. When this is non-zero, producers with `acks=all` start failing — the cluster has lost durability guarantees for those partitions.
OfflinePartitionsCount
Partitions with no live leader. Any non-zero value = data is unavailable for read or write. Critical alert; usually means controller failure or rapid broker churn.
ActiveControllerCount
Should be exactly 1 across the cluster. 0 = no controller (controller election in progress or failed); 2+ = split-brain (catastrophic). Sum the metric across all brokers.
IsrShrinksPerSec / IsrExpandsPerSec
Rate of ISR membership changes. Healthy steady state is near zero. Frequent shrink/expand = network instability between brokers or one broker repeatedly falling behind.
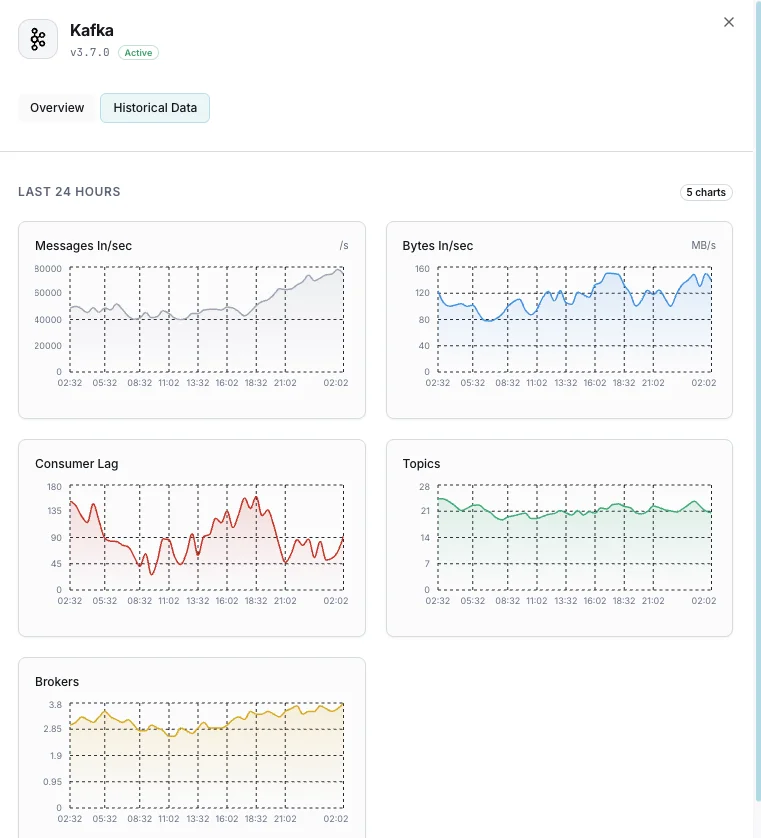
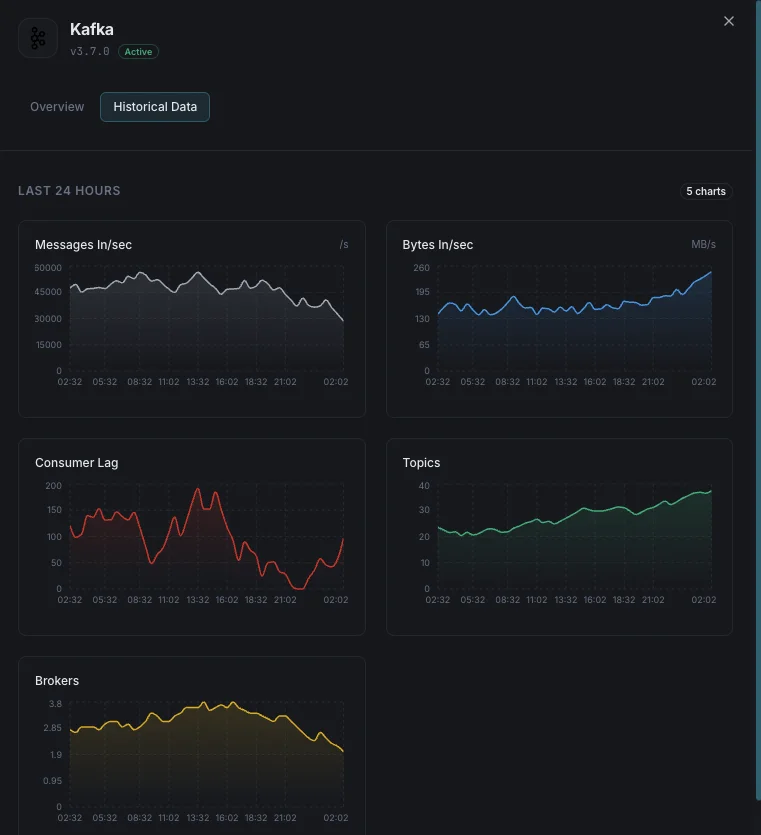
Consumer Group Lag (records_lag_max)
Max lag across all partitions a consumer group is reading. The headline metric for consumer health — alert when lag > your processing-time budget for downstream effects.
UncleanLeaderElectionsPerSec
Rate of out-of-sync replicas being promoted to leader (with data loss). Should be 0 — non-zero means `unclean.leader.election.enable=true` AND a real failure event occurred.
MessagesInPerSec / BytesIn / BytesOut
Per-broker and per-topic throughput. Sudden drops with stable producer count = ingest issue; sudden spikes = retry storm or runaway producer.
Request Latency (p99)
p99 of Produce, Fetch, Metadata request handler time from `kafka.network:type=RequestMetrics`. Catches broker overload before it causes timeouts at clients.
LeaderCount per Broker
Partition leaders per broker. Uneven distribution (one broker holding 60%+ of leaders) = imbalanced cluster, fix with `kafka-reassign-partitions.sh` or.
Log Size per Topic
Aggregate on-disk log size per topic from `kafka.log:type=Log,name=Size`. Drives disk-space alerts and informs tiered-storage policies in Kafka 3.8+.
RemoteLogManager (tiered storage)
Kafka 3.8+ tiered storage metrics: bytes uploaded to remote tier, segments in remote vs local, fetch latency from remote. Catches S3 connectivity / IAM issues breaking tiered fetches.
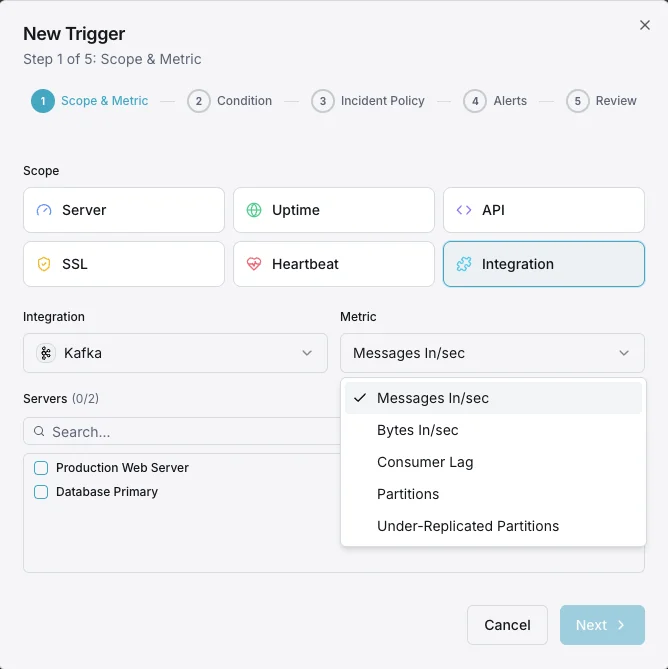
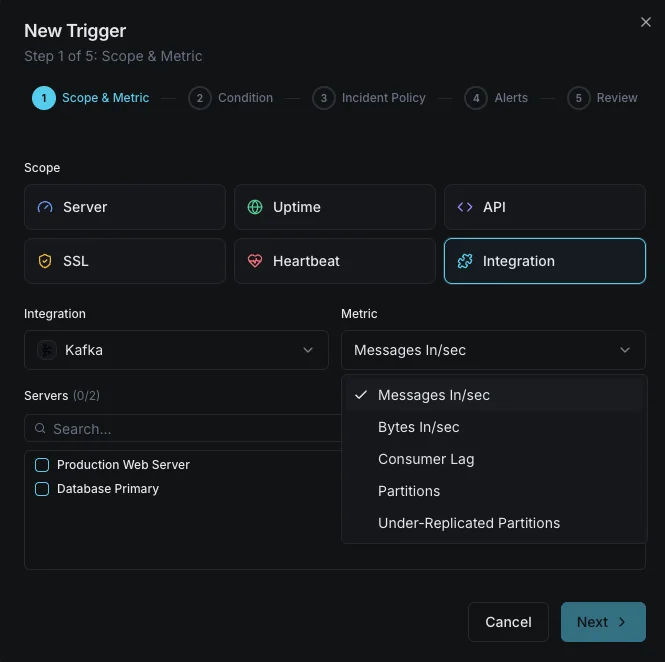
Configurable alert triggers
Set up custom triggers in your dashboard to get notified the moment Apache Kafka metrics cross your defined thresholds.
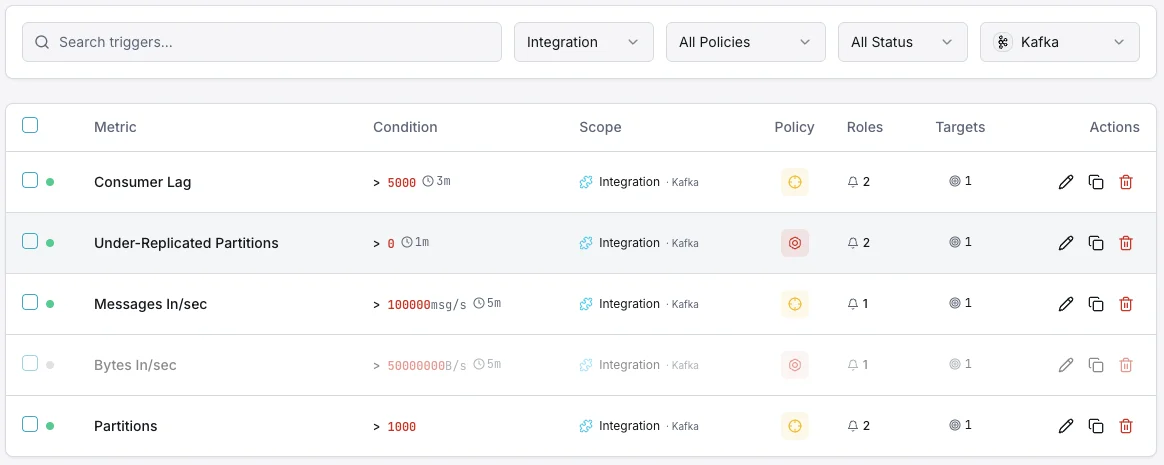
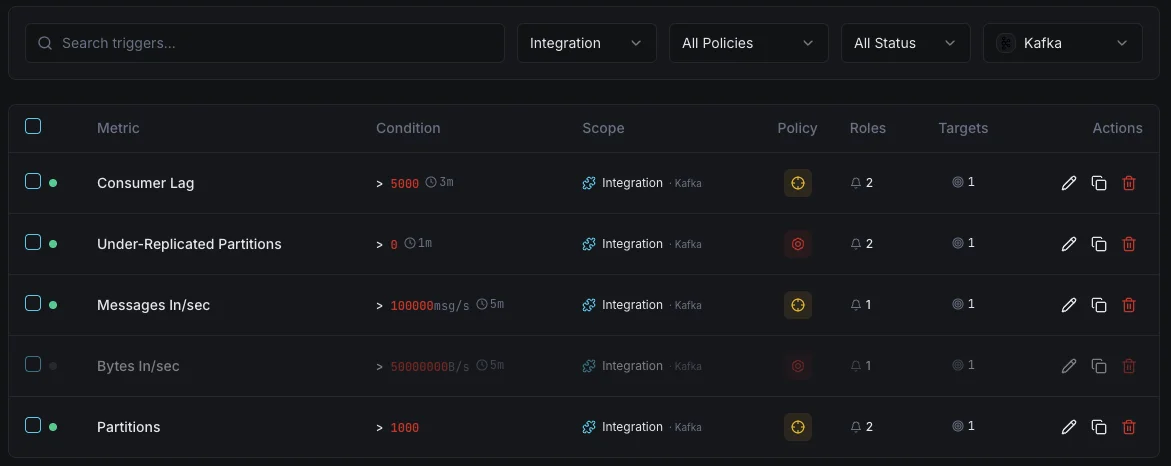
Consumer Lag
criticalFires when consumer falls behind.
Under-Replicated Partitions
criticalAlerts on replication issues.
Broker Down
criticalTriggers when a broker leaves the cluster.
Disk Usage
warningFires when broker disk is filling up.
Importance of Kafka Monitoring
Kafka processes trillions of messages daily. Consumer lag, broker failures, and partition imbalance can cause data pipeline failures.
- Detect consumer lag before data loss
- Monitor ISR for data durability
- Track broker health across clusters
- Ensure partition balance
Why Choose Xitoring
Enterprise-grade Kafka monitoring.
- Zero-config setup
- Global nodes
- Unified dashboard
- Multi-channel alerts
- Historical retention
Common Kafka monitoring scenarios
Where Kafka typically runs today — and what could go wrong if no one's watching.
The messaging backbone connecting your apps
When Kafka carries the messages that move data between your apps, any slowdown means one app is quietly falling behind — and the consequences (delayed updates, stale data, broken workflows) only show up later. We catch the lag the moment it begins so it never becomes a customer-visible problem.
Kafka running inside Kubernetes
When Kafka runs in Kubernetes, the platform constantly moves it around — and a routine restart can briefly weaken the safety net that keeps your data protected. We watch every restart and rebalance so a normal update can't quietly leave the system one failure away from data loss.
Self-managed Kafka for high-volume data
Companies running their own Kafka at scale need it to be rock-solid — it's usually carrying the most valuable data they have. We watch the signals that keep it healthy so the team can focus on building products instead of firefighting the messaging layer.
Prerequisites for Apache Kafka
Make sure you've got these in place — most installs are a 60-second job once they are.
- Kafka 3.x or 4.x brokers with JMX enabled (default port 9999) — OR Confluent Platform / Redpanda via shared API
- Network reachability from Xitogent to each broker's JMX port
- JMX authentication credentials if security is configured (or anonymous JMX on the internal monitoring network)
Get started in minutes
Install Xitogent on each broker
Install the lightweight Xitogent monitoring agent on every Kafka broker you want to monitor.
curl -s https://xitoring.com/install.sh | sudo bash -s -- --key=YOUR_API_KEYEnable JMX on each broker
Kafka exposes broker metrics through JMX. Set `KAFKA_JMX_OPTS` to enable a JMX listener (typically port 9999) on each broker, reload the service, and confirm the agent host can connect to the JMX port.
sudo xitogent integrateEnable the Kafka integration
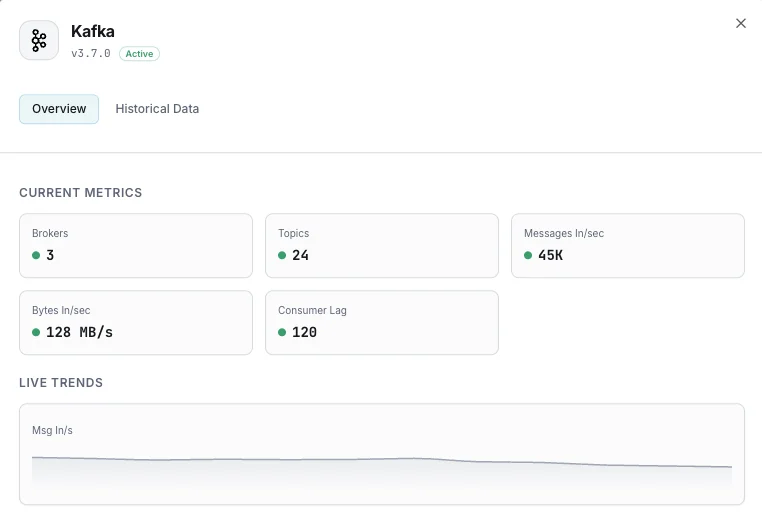
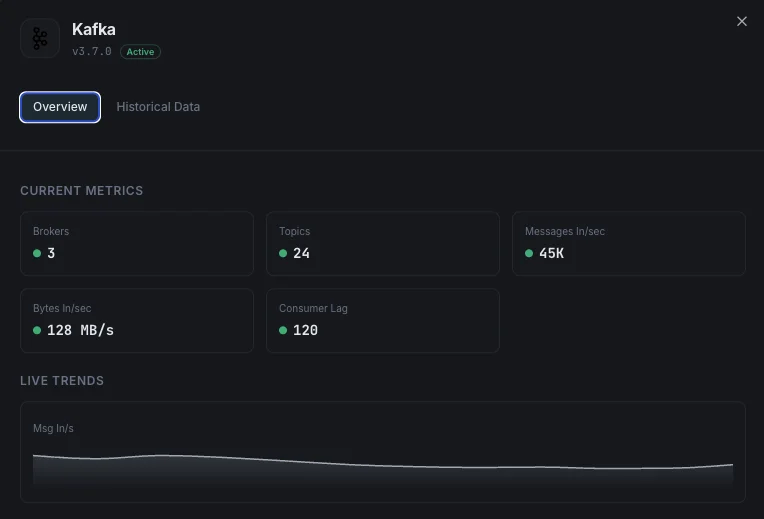
Use the Xitoring dashboard or CLI to enable the Kafka integration. Xitogent auto-discovers broker IDs, topics, and consumer groups across the cluster.
Configure alert thresholds (optional)
Set custom thresholds for Consumer Lag, Under-Replicated Partitions, or Broker Down events to catch replication issues and back-pressure before consumers fall behind.
Verify it's working
Run this command on the server to confirm Xitogent picked up the integration. Fresh metrics will start streaming to your dashboard within ~30 seconds.
sudo xitogent statusConsidering alternatives?
See how Xitoring stacks up against the alternatives for Apache Kafka monitoring — flat pricing, deeper integrations, and one agent that covers your whole stack.


Frequently asked questions
What is Kafka monitoring?
How do I monitor Kafka consumer lag?
What are under-replicated partitions and how do I fix them?
How do I monitor Kafka broker JMX metrics with Prometheus?
What is KRaft mode and how does monitoring change without ZooKeeper?
How do I detect Kafka offline partitions?
How do I monitor a Kafka cluster on Kubernetes (Strimzi)?
Kafka vs Redpanda monitoring — what's different?
What Kafka versions are supported?
Start monitoring Apache Kafka today
Set up in under 60 seconds. No credit card required. Full metrics from day one.
Start Free TrialKeep exploring