KVM Monitoring with Xitoring
KVM (Kernel-based Virtual Machine) is an open-source virtualization solution built into the Linux kernel. It turns the Linux kernel into a hypervisor so that a physical host can run multiple virtual machines — each guest VM gets private virtualized hardware (CPU, memory, storage, network, etc.) while sharing the underlying host system.
As businesses scale and run many virtual machines on a few physical hosts, keeping track of resource usage, health, and availability becomes critical. That’s where KVM-Monitoring comes in: instead of manually logging into each VM or host, monitoring tools track the performance and status centrally — providing real-time visibility across the entire virtual infrastructure.
Why KVM-Monitoring Matters
-
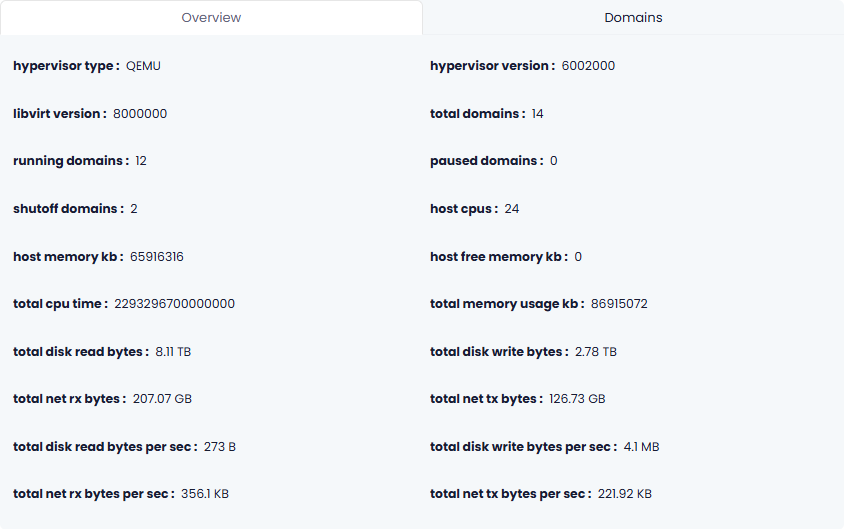
Full utilization insights. With KVM-monitoring, you can observe CPU usage (per core), memory consumption, disk I/O, storage pool status, network traffic, and more — both at the host level and per-VM level.
-
Prevent overcommitment & resource contention. Virtualization lets multiple VMs share hardware. Without monitoring, you risk overloading CPU, RAM, or storage — which may degrade performance for many VMs at once. Monitoring helps detect such issues before they impact uptime.
-
Centralized, scalable management. Instead of logging into each VM, admins get a unified dashboard for performance, health, and availability. This simplifies management for large infrastructures with many hosts and VMs.
-
Proactive alerting & trend analysis. Many KVM-monitoring solutions provide performance history, utilization trends, and alerting — helping you forecast resource needs and plan capacity upgrades.
-
Better stability for production workloads. For environments running critical services (e.g. databases, web servers, business applications), monitoring ensures that resource bottlenecks or VM failures are detected early — minimizing downtime and performance degradation.
Common Use Cases & Who Benefits from KVM-Monitoring
-
Small to medium businesses (SMBs) running multiple virtual servers on a few physical hosts — to ensure efficient resource usage and avoid performance bottlenecks as demand grows.
-
Enterprises and data centers hosting many VMs (e.g. web servers, application servers, databases) — to centralize monitoring and manage capacity at scale.
-
DevOps & platform teams needing insight across infrastructure — monitoring helps with performance optimization, capacity planning, and early detection of failing VMs.
-
Providers of VPS or cloud services — to guarantee SLA, deliver stable performance, and detect overloaded hosts before affecting customers.
-
Hybrid / dynamic environments with frequent VM spin-up or tear-down — automatic discovery and monitoring helps maintain visibility without manual effort.


What Does a Good KVM-Monitoring Setup Monitor
A comprehensive KVM-monitoring system should track at least the following metrics and aspects:
Host-level metrics
-
CPU utilization (overall and per core)
-
Memory usage and swap usage
-
Storage usage: status of storage pools and virtual volumes (total capacity, used/free, read/write I/O)
-
Network interface status and network bandwidth / packet statistics
Virtual-machine (guest) metrics
-
VM availability / uptime — are the VMs running or down?
-
Performance metrics per VM: CPU usage, memory, disk I/O, network I/O.
-
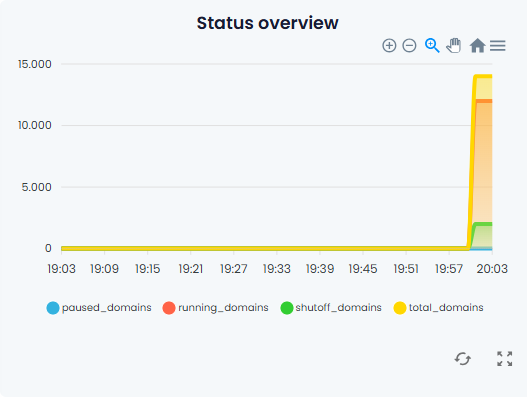
Historical performance charts, heat maps, load over time — to detect trends or recurring issues.
Alerts & thresholds
-
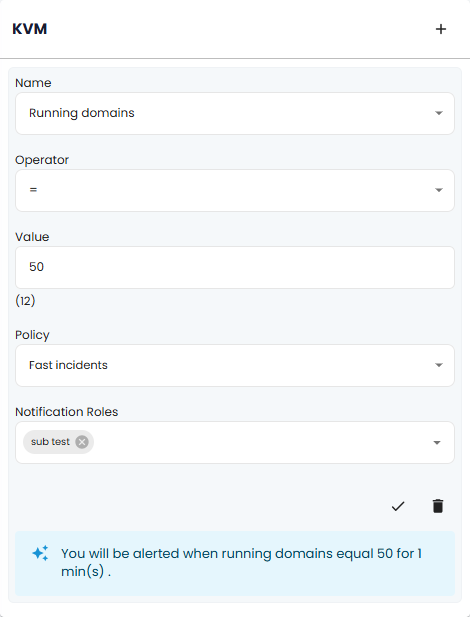
Notifications when resource usage exceeds defined thresholds (e.g. high CPU load, low free storage, network saturation) — helps admins act before problems escalate.
-
Aggregated health & event logs for host and VMs to quickly spot failures or anomalies.
Scalability and automation support
-
Automatic discovery of KVM hosts and their VMs (especially useful in dynamic environments where VMs are frequently added or removed).
-
API or CLI support for integrations with other monitoring, alerting or orchestration tools.
How a Monitoring Tool Interacts With KVM
Modern monitoring tools typically use a mix of APIs and native Linux commands to collect data from KVM hosts. Here is how they generally work:
-
Discovery — the monitoring software discovers KVM hosts (via IP/hostname) and lists all active VMs on each host.
-
Data collection — using CLI commands or virtualization APIs (e.g. via
libvirt), the tool gathers metrics: CPU, memory, disk I/O, storage pool status, network I/O, VM availability, etc. -
Storage & historical tracking — metrics are recorded over time, enabling trend analysis, heat charts, and historical performance reports.
-
Alerting & reporting — the system alerts administrators if thresholds are exceeded, or if a VM or host becomes unavailable. Event logs and health summaries help troubleshooting.

How to start monitoring your KVM?
-
1
Install Xitogent
Easily run one command and install Xitogent on your Linux or Windows server
-
2
Enable Integration
Now run `xitogent integrate` on your server and select KVM, it will show you the process of the installation.
-
3
Configure Triggers
You can easily configure several triggers including CPU and Memory Usage and alerts and receive them in your favorite notification channel.
Start monitoring your KVM today
FAQ
How much does it cost for each KVM monitoring?
KVM monitoring is included at no cost for all servers. on the Flexible plan, each server costs $5.00/mo and you can save much more on combo plans (up to 50%)
More details about pricing
What is KVM monitoring in Xitoring?
Xitoring monitors your KVM host and virtual machines in real time, providing metrics for CPU, memory, disk I/O, storage pools, and network traffic, all from one unified dashboard.
How does Xitoring collect data from my KVM server?
Xitoring uses its lightweight Linux agent to gather host-level and VM-level metrics through libvirt and native system statistics. No complex setup is required.
Can Xitoring monitor both the KVM host and guest VMs?
Yes. Xitoring detects all VMs automatically and monitors their performance, uptime, and resource usage alongside the physical host.
Does Xitoring alert me when a VM is overloaded or offline?
Absolutely. You can set thresholds for CPU, RAM, disk, network, or uptime. Xitoring sends alerts instantly through multiple channels (email, SMS, Telegram, Slack, etc.).
Do I need to install anything inside the virtual machines?
Only if you want deep VM monitoring (processes, services, system load). For basic VM stats, Xitoring only needs the agent on the KVM host.
Can Xitoring help prevent resource overcommitment?
Yes. Xitoring visualizes real-time host usage and per-VM usage, making it easy to spot when VMs compete for CPU, RAM, or disk performance.
Does Xitoring support monitoring multiple KVM hosts?
Yes. You can add unlimited KVM hosts, group them, compare resource usage, and manage them from a single dashboard.
How fast can I start monitoring my KVM host?
Setup takes under a minute, install the Xitoring agent on your Linux host and the dashboard automatically detects your KVM environment.
Need Help or Quote?
Have questions or need assistance? Our dedicated support team is here to help. Reach out to us anytime, and we’ll be happy to assist you.


