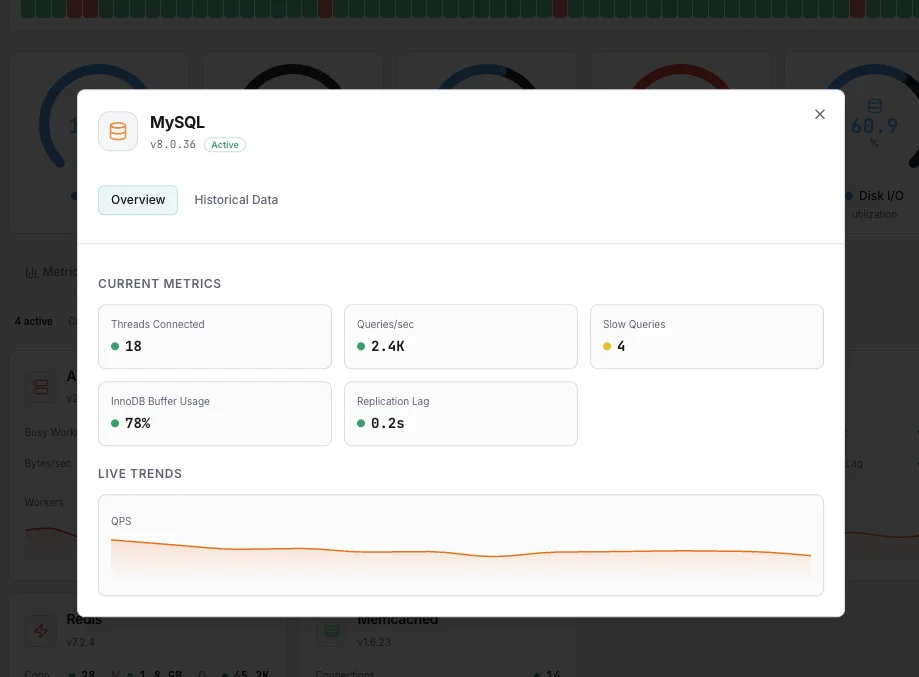
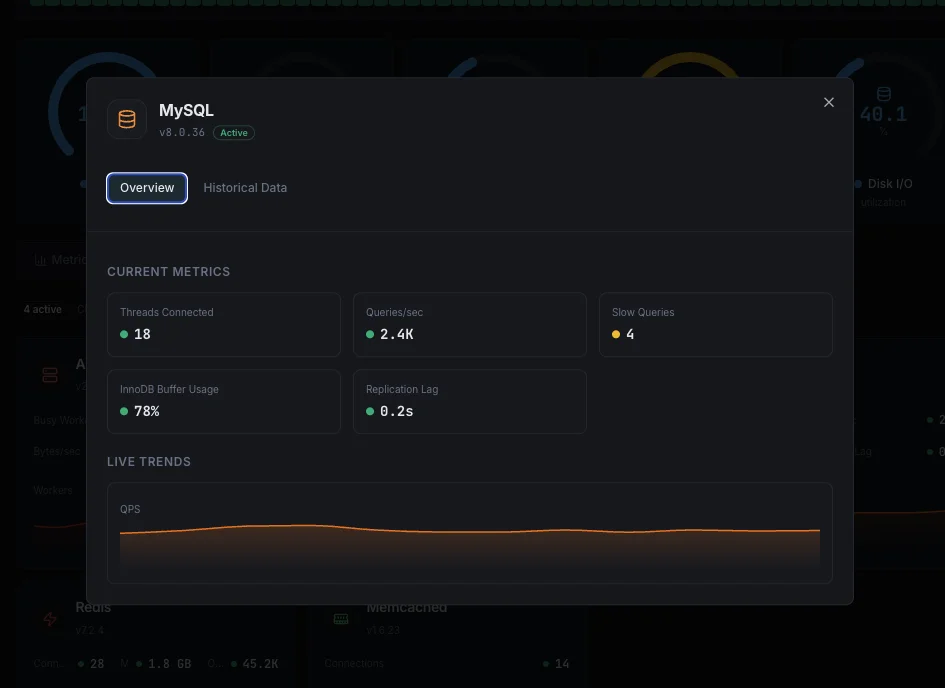
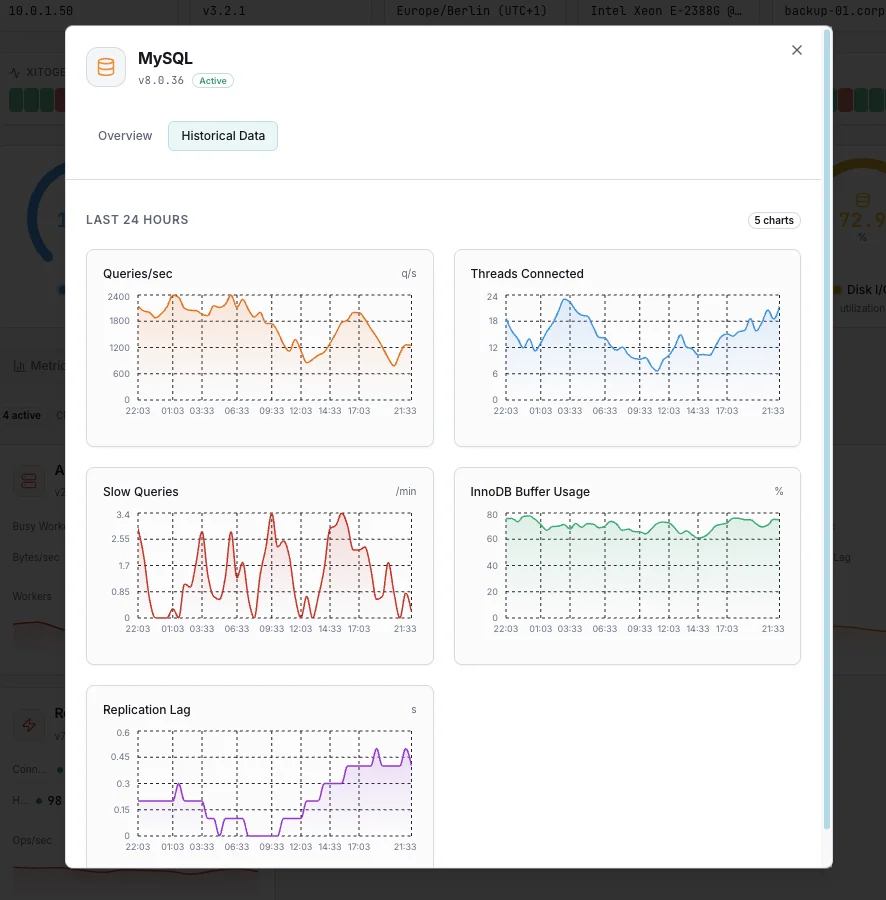
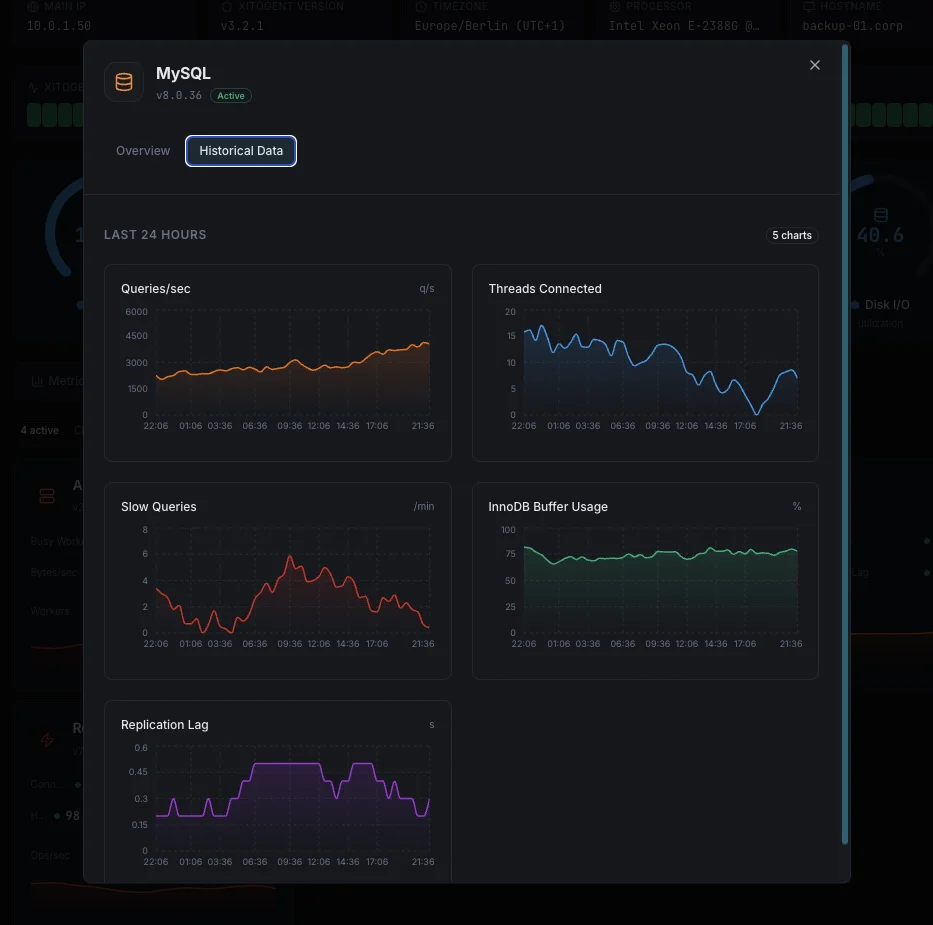
MySQL Monitoring
Monitor MySQL InnoDB buffer pool hit ratio, threads connected/running, slow queries, replication lag, and lock waits in real time — via `performance_schema` and `SHOW GLOBAL STATUS`.
Why monitor MySQL?
MySQL powers WordPress, Laravel, Magento, and most LAMP-stack workloads. When buffer pool churn climbs, slow queries pile up, or replication lags, app response time degrades before anyone notices. Per-database monitoring is the difference between a 60-second alert and finding a connection storm in next week's outage post-mortem.
MySQL monitoring, explained
MySQL monitoring catches buffer pool churn, slow queries, replication drift, and connection-thread saturation before they slow every read in your app or cascade into a replica failover storm. For WordPress, Laravel, Magento, and any RDS/Aurora-backed workload, per-database visibility is the single most useful signal between user-reported slowness and root cause. Xitoring auto-discovers your MySQL, queries performance_schema and the standard status views, and routes alerts to Slack, PagerDuty, Telegram, or your existing on-call.
What we monitor
Threads_connected / Threads_running
Currently open connections vs threads actively executing queries. Threads_connected near `max_connections` triggers connection refusal; Threads_running spikes indicate query slowdown.
Queries / sec (Questions)
Rate of client SQL statements (SELECT, INSERT, UPDATE, DELETE) — derived from the `Questions` counter. Sudden drops signal database hangs or downstream failure.
InnoDB Buffer Pool Hit Ratio
Computed as `Innodb_buffer_pool_read_requests / (Innodb_buffer_pool_read_requests + Innodb_buffer_pool_reads)`. Target 99%+; below 95% means you're hitting disk too often — increase `innodb_buffer_pool_size`.
Innodb_row_lock_waits & lock time
Number of times InnoDB had to wait for a row lock, plus total wait time in ms. Rising values surface contention from long transactions or hot rows.
Innodb_deadlocks
Count of deadlocks detected by the InnoDB monitor. Any non-zero rate is a sign of application transaction-ordering issues — pair with `SHOW ENGINE INNODB STATUS` for the latest deadlock graph.
Slow_queries / sec
Rate of queries exceeding `long_query_time` (default 10s). Lower the threshold to 1s and trend the rate — sustained growth means query-plan regression or missing indexes.
Replication Lag (Seconds_Behind_Source)
Per-replica delay from primary, via `SHOW REPLICA STATUS`. MySQL 8.0+ provides GTID-based `original_commit_timestamp`/`immediate_commit_timestamp` for precise lag — Xitogent uses both.
Created_tmp_disk_tables / sec
Temporary tables that overflowed to disk. Sustained non-zero rate means `tmp_table_size`/`max_heap_table_size` are too small or queries need rewriting.
Aborted_connects / Aborted_clients
Failed handshakes vs clients that disconnected ungracefully. Aborted_connects flags auth/network issues; Aborted_clients flags app-side connection leaks or timeouts.
Bytes_sent / Bytes_received
Network throughput to and from MySQL. Use alongside Queries/sec to spot result-set bloat (high bytes / low query count) or scan-heavy patterns.
Open_tables vs table_open_cache
Currently open table handles vs configured cache size. When Open_tables approaches the cache limit, MySQL evicts and reopens — measurable latency cost.
Innodb_os_log_pending_fsyncs
Pending fsyncs to the InnoDB redo log. Sustained non-zero values mean your `sync_binlog`/`innodb_flush_log_at_trx_commit` settings are bottlenecked on disk.
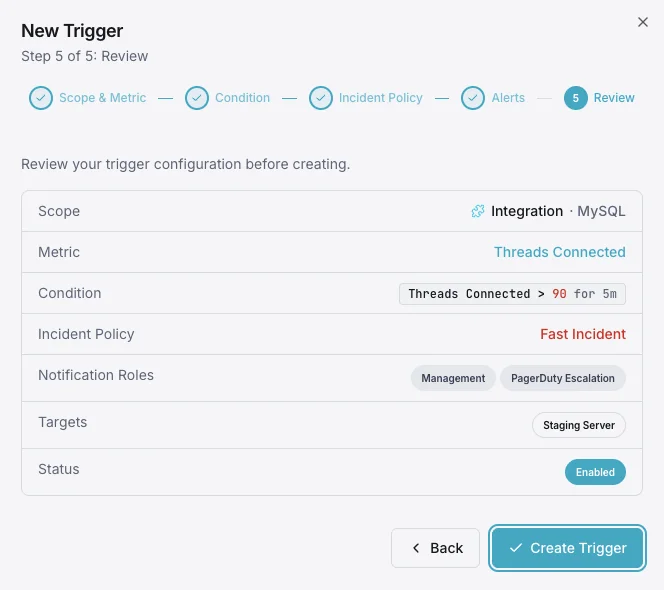
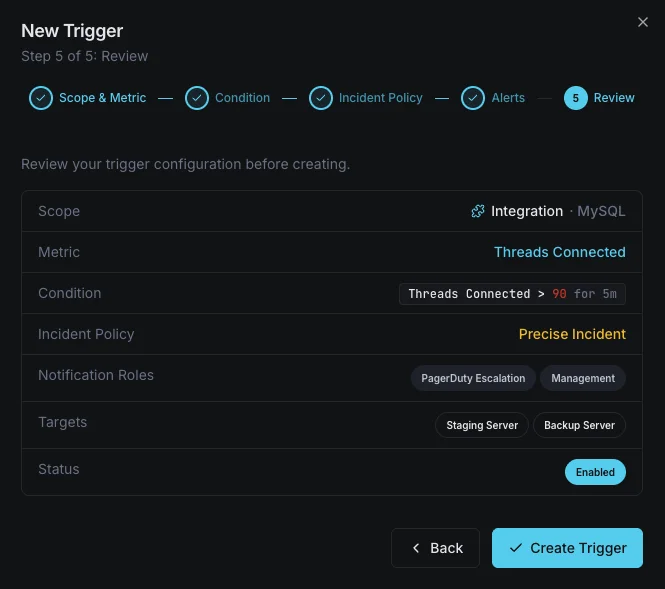
Configurable alert triggers
Set up custom triggers in your dashboard to get notified the moment MySQL metrics cross your defined thresholds.
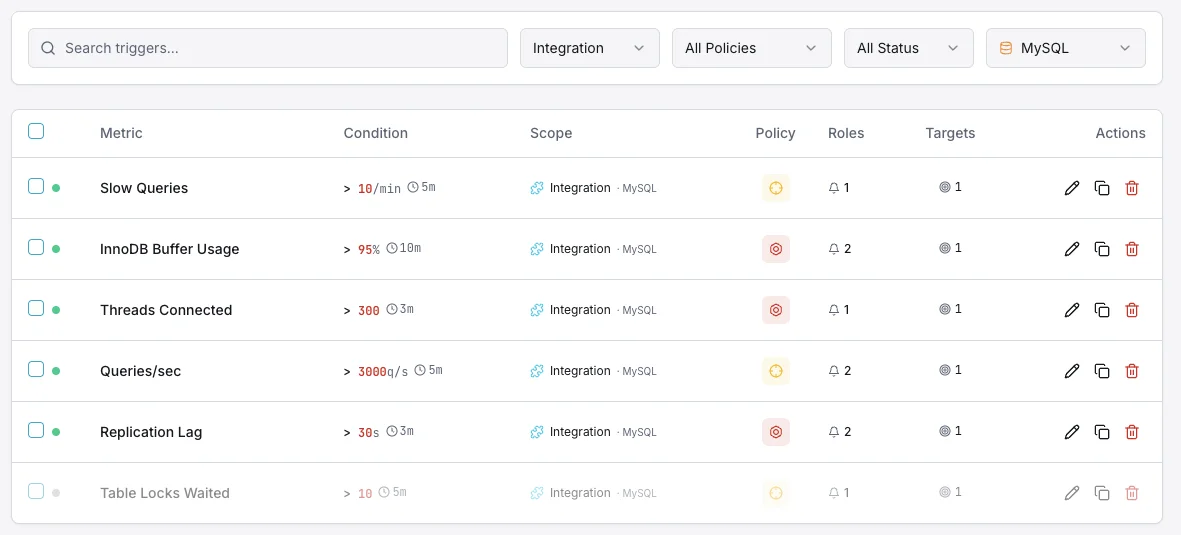
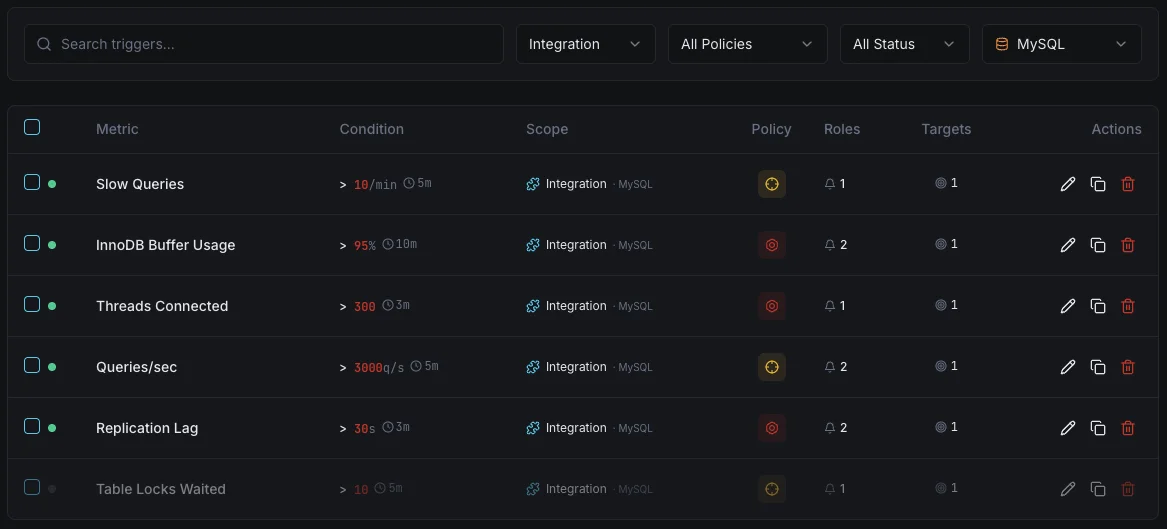
Active Connections
criticalFires when active connections approach max_connections, risking new connection refusal and application errors.
Replication Lag
criticalTriggers when replication falls behind, risking data inconsistency between master and replicas.
Slow Queries
warningAlerts when slow query count exceeds threshold, indicating performance degradation.
InnoDB Buffer Pool
warningFires when buffer pool hit ratio drops, indicating excessive disk I/O.
Aborted Connections
warningTriggers on connection failure spikes, indicating authentication or network issues.
Table Lock Waits
criticalAlerts when lock contention increases, degrading query performance.
Importance of MySQL Monitoring
MySQL handles critical data for millions of applications. Without proper monitoring, slow queries, replication drift, and connection exhaustion can lead to outages and data inconsistency.
- Detect slow queries before they impact user experience
- Prevent connection pool exhaustion with threshold alerts
- Monitor replication for data consistency across replicas
- Track InnoDB performance for optimal storage engine health
- Identify lock contention and query bottlenecks early
Why Choose Xitoring
Xitoring delivers enterprise-grade MySQL monitoring with zero-config setup. Our lightweight agent auto-discovers your MySQL instances, starts collecting metrics in under 60 seconds, and integrates with your existing notification channels.
- One-command install — no complex YAML or config files
- 15+ global monitoring nodes for low-latency checks
- Unified dashboard for servers, databases, and uptime
- Flexible alerting via Slack, PagerDuty, Telegram & more
- Historical data retention for capacity planning & audits
Common MySQL monitoring scenarios
Where MySQL typically runs today — and what could go wrong if no one's watching.
Managed cloud database (AWS, Azure, Google)
Cloud providers handle the servers, but they don't tell you when your own queries are slow, your connections are running out, or a backup copy is quietly falling behind. We catch the issues the provider leaves to you, so a slowdown doesn't catch the team off guard.
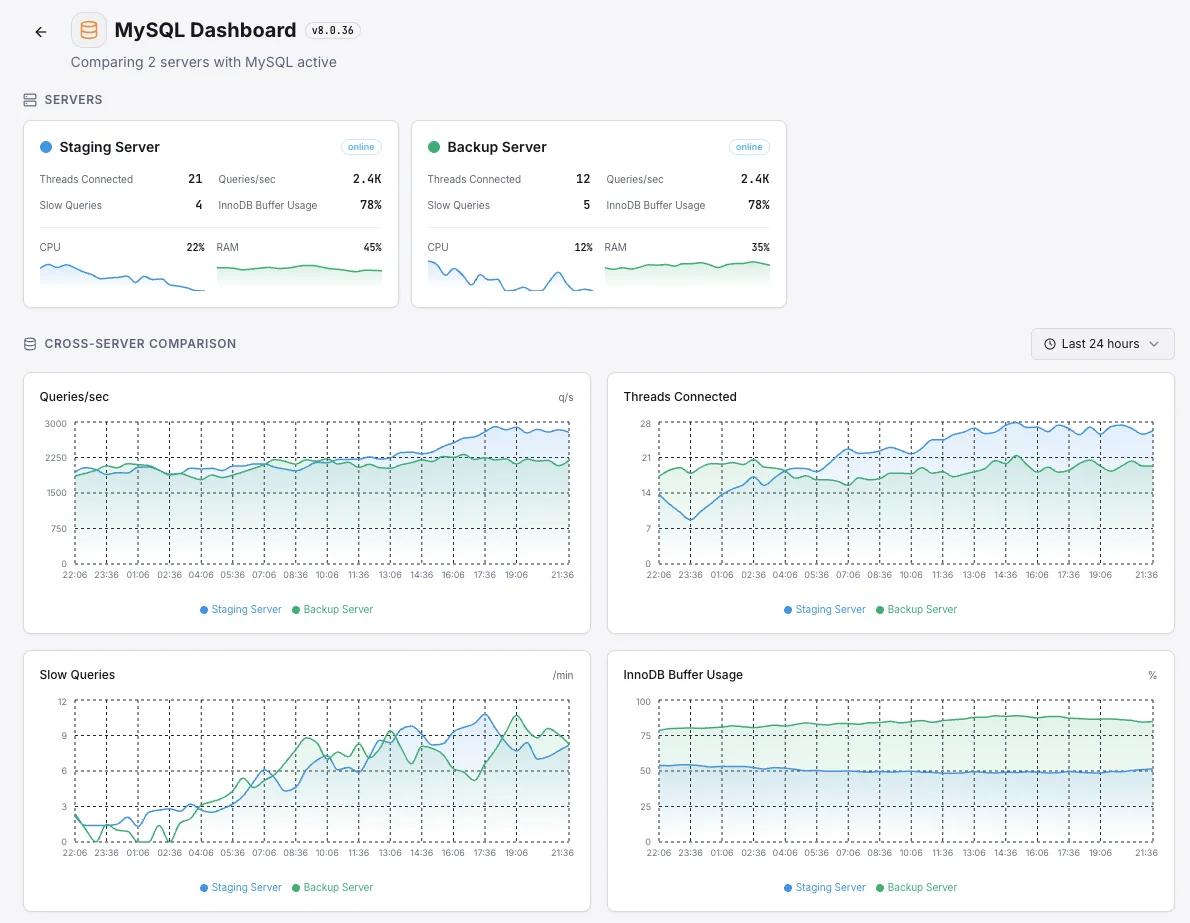
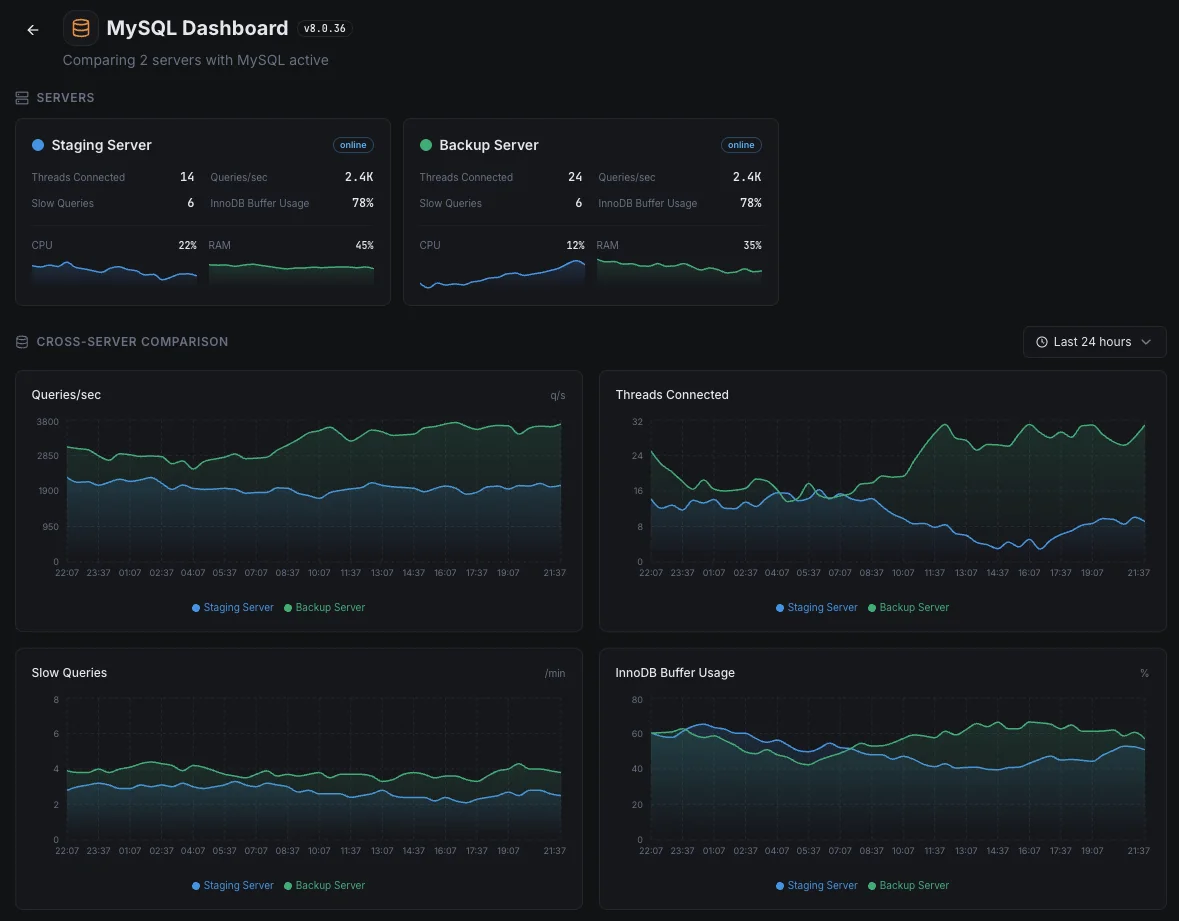
Main database with live backup copies
Production databases typically run a live backup ready to take over if the main one fails. When that backup quietly falls behind, what should be a smooth handoff becomes a real outage — sometimes with data loss. We watch every copy so the backup is truly ready when you need it.
Database running inside Kubernetes
Databases in Kubernetes get moved, restarted, and updated by the platform automatically. Most of the time it's safe — when it isn't, you usually find out from frustrated users. We surface the early warning signs so the team can step in before a routine update becomes an incident.
Prerequisites for MySQL
Make sure you've got these in place — most installs are a 60-second job once they are.
- MySQL 5.7, 8.0, or 8.4 LTS running on the server
performance_schema = ON(default in 5.7+; set in[mysqld]if disabled)- A monitoring user with
PROCESS,REPLICATION CLIENT, andSELECTonperformance_schema(recommendMAX_USER_CONNECTIONS 5cap)
Get started in minutes
Install Xitogent on your server
If you haven't already, install the lightweight Xitogent monitoring agent on your server.
curl -s https://xitoring.com/install.sh | sudo bash -s -- --key=YOUR_API_KEYCreate a monitoring user in MySQL
Create a dedicated read-only user for Xitogent to collect metrics:
CREATE USER 'xitoring'@'%' IDENTIFIED BY 'your_secure_password';
GRANT REPLICATION CLIENT ON *.* TO 'xitoring'@'%' WITH MAX_USER_CONNECTIONS 5;
GRANT PROCESS ON *.* TO 'xitoring'@'%';
GRANT SELECT ON performance_schema.* TO 'xitoring'@'%';
FLUSH PRIVILEGES;Enable the MySQL integration
Use the Xitoring dashboard or CLI to enable the MySQL integration with the monitoring credentials.
sudo xitogent integrateConfigure alert thresholds (optional)
Set custom thresholds for metrics like replication lag, slow queries, or connection count to get notified when something needs attention.
Verify it's working
Run this command on the server to confirm Xitogent picked up the integration. Fresh metrics will start streaming to your dashboard within ~30 seconds.
sudo xitogent statusConsidering alternatives?
See how Xitoring stacks up against the alternatives for MySQL monitoring — flat pricing, deeper integrations, and one agent that covers your whole stack.


Frequently asked questions
What is MySQL monitoring?
How do I monitor MySQL InnoDB buffer pool hit ratio?
How do I detect slow queries in MySQL?
How do I monitor MySQL replication lag?
What is performance_schema and how do I use it?
How do I monitor MySQL on RDS or Aurora?
What's the difference between MySQL and MariaDB monitoring?
Will this integration affect MySQL performance?
What MySQL versions are supported?
Start monitoring MySQL today
Set up in under 60 seconds. No credit card required. Full metrics from day one.
Start Free TrialKeep exploring