
OpenLiteSpeed Monitoring
Monitor OpenLiteSpeed request rate, LSCache (Public/Private) hit ratio, virtual host status, external app workers, and SSL connections in real time — agent-based via the native `.rtreport` stat file.
Why monitor OpenLiteSpeed?
OpenLiteSpeed is the open-source LiteSpeed edition — the engine behind most CyberPanel WordPress hosting, plus Docker, Kubernetes, and Magento deployments. Cache regressions, per-vhost slowdowns, and external app failures degrade sites silently. Monitoring surfaces problems while there's still time to fix them.
OpenLiteSpeed monitoring, explained
OpenLiteSpeed monitoring catches cache regressions, worker saturation, and per-virtual-host slowdowns before they hit your users — critical for CyberPanel WordPress hosts and any multi-site OLS deployment. Xitoring auto-discovers your OLS instance, polls the same .rtreport stat file the WebAdmin Console reads, and surfaces per-vhost cache and connection metrics in one dashboard — with alerts routed to Slack, PagerDuty, Telegram, or wherever your team already responds.
What we monitor
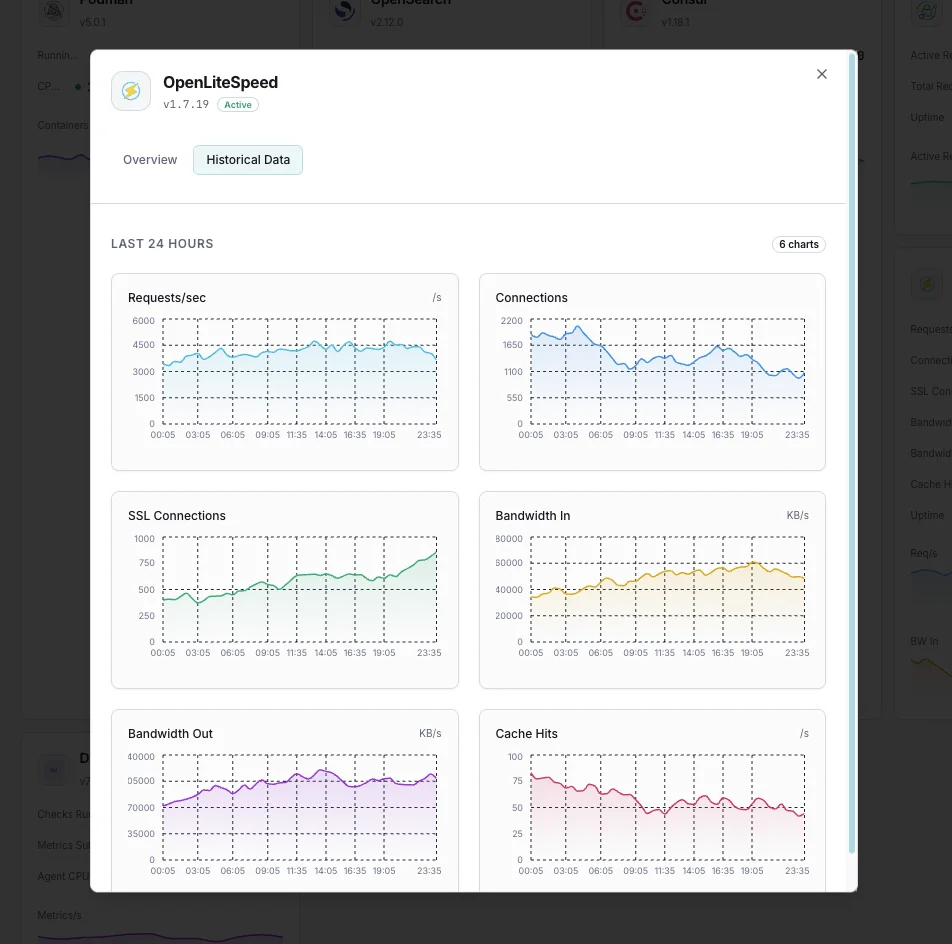
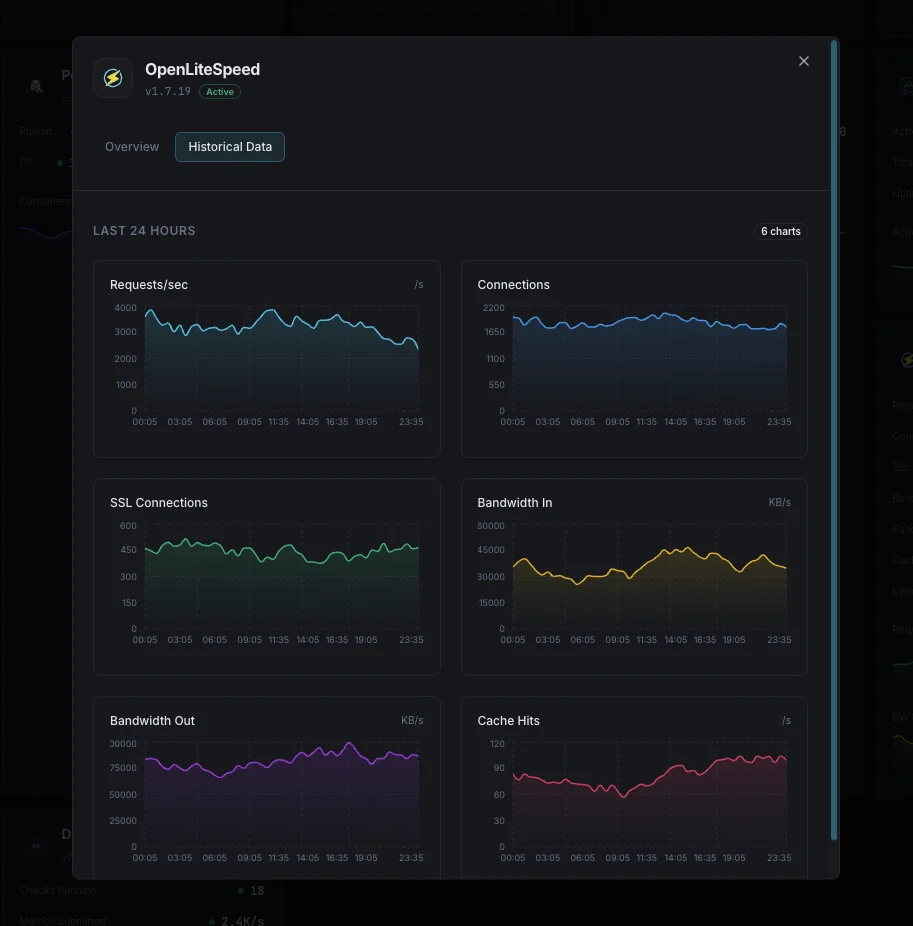
Requests / sec
Live HTTP request rate served by OLS, broken down by virtual host. The first signal for traffic surges and attacks.
Pub Cache Hits / sec
LSCache public-cache hits per second — the headline ranking metric for WordPress + LSCWP setups. Sustained values close to total request rate mean LSCache is working.
Private Cache Hits / sec
LSCache private-cache hits — logged-in user pages and personalized content. Tracked separately so a logged-in cache regression doesn't hide behind public-cache numbers.
Static Hits / sec
Static-asset hits per second. The static-vs-dynamic ratio drives `cacheLookup` tuning in your VirtualHost configuration.
Request Processing
Current requests in-flight per virtual host. Sustained non-zero values mean handler workers can't drain the queue.
Response Time
End-to-end latency to serve a request. Track p50, p95, and p99 to catch tail-latency regressions invisible to averages.
HTTP / HTTPS Connections
Active HTTP and HTTPS connections, separated. SSL Connections approaching `SSLConfig` worker limits triggers TLS handshake failures before regular requests degrade.
BPS_IN / BPS_OUT
Bytes-per-second throughput on plain HTTP. Anomalies often surface here before they show up in request counts.
SSL_BPS_IN / SSL_BPS_OUT
Bytes-per-second throughput on HTTPS. Separate from plain HTTP for cleaner diagnosis of TLS-specific issues.
External Application Status
Status and worker count for LSPHP / LSAPI external applications. Catches PHP slowdowns inside OLS before they cascade to user-visible 5xx errors.
Virtual Host Status
Per-vhost request-processing status. Lets you isolate which site or domain is degraded when overall numbers look fine — critical for shared hosting.
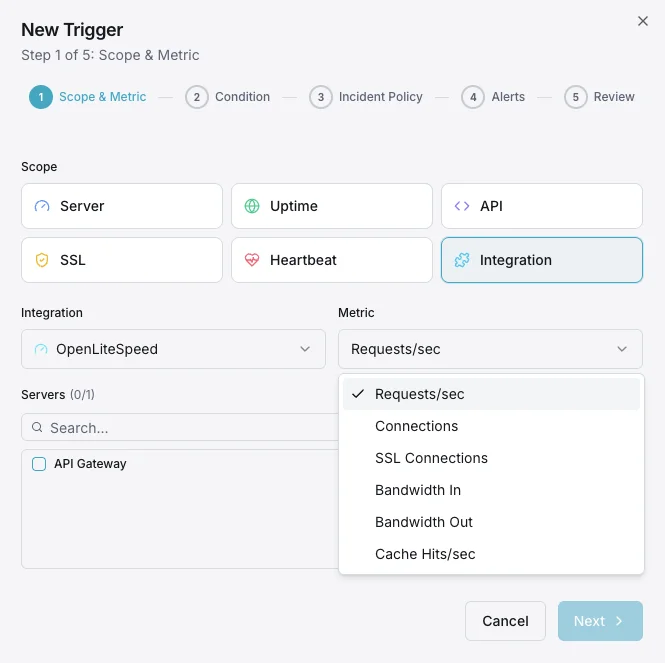
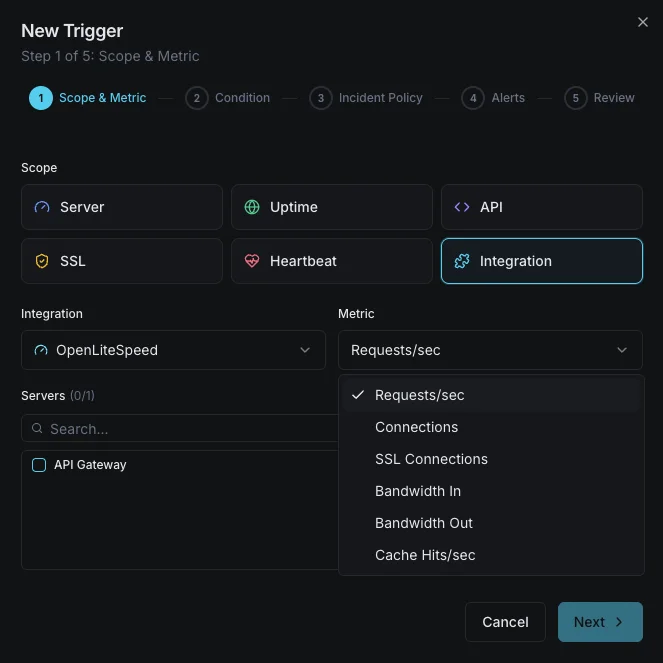
Configurable alert triggers
Set up custom triggers in your dashboard to get notified the moment OpenLiteSpeed metrics cross your defined thresholds.
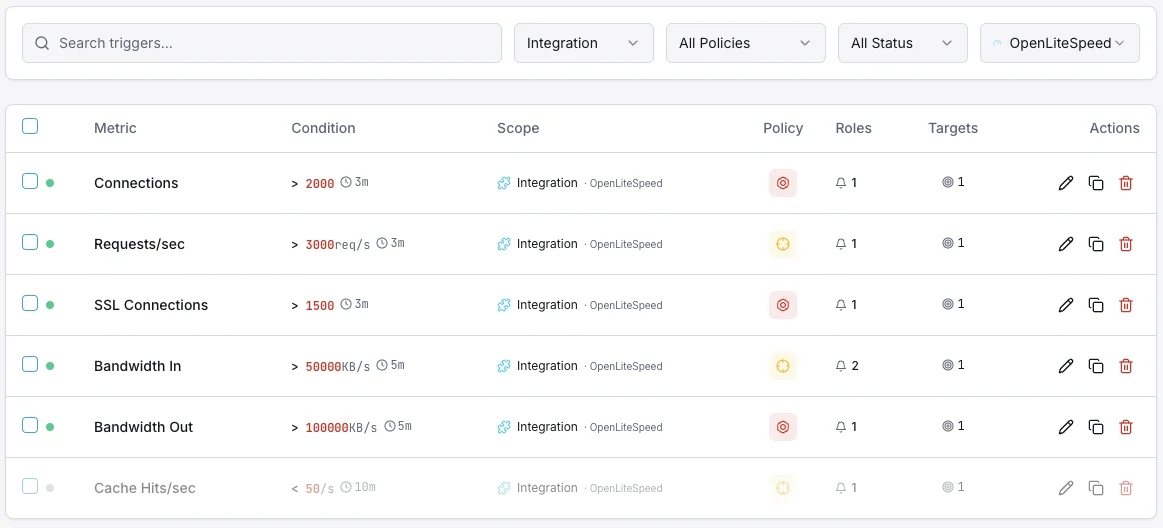
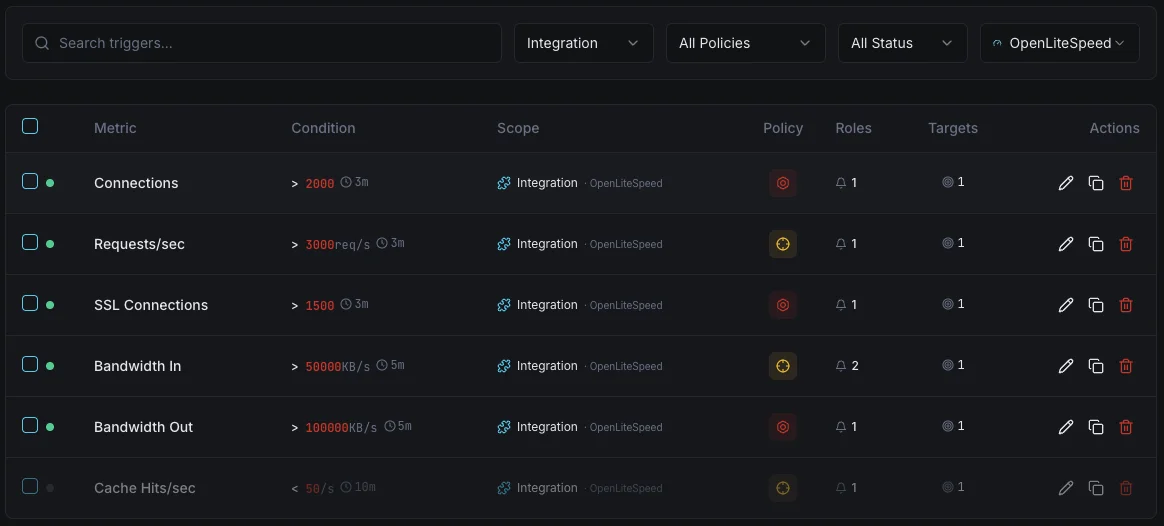
Request Rate
warningFires when request rate exceeds threshold.
Cache Hit Ratio
warningTriggers when cache ratio drops.
Response Time
criticalAlerts on high response latency.
Connections
criticalFires when connections approach limits.
Importance of OpenLiteSpeed Monitoring
OpenLiteSpeed powers cost-effective, high-performance web hosting. Without monitoring, cache inefficiencies and connection issues go undetected.
- Track cache performance to maximize speed
- Monitor connections to prevent bottlenecks
- Detect response time degradation early
- Ensure optimal resource utilization
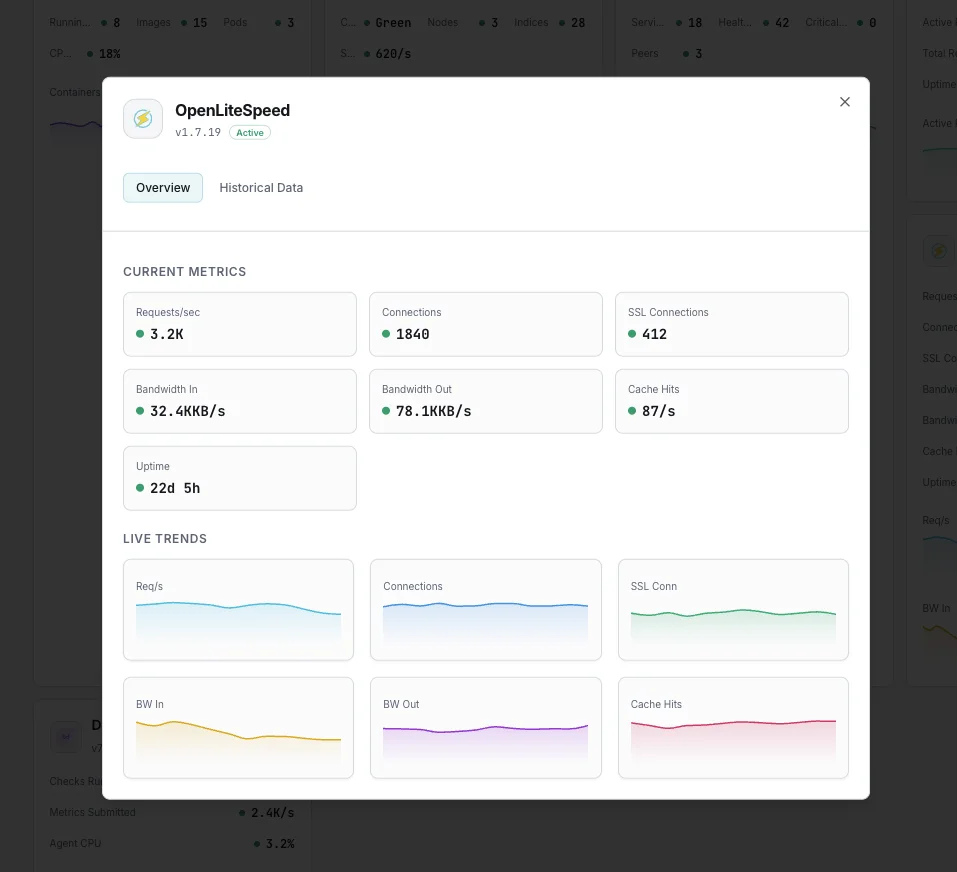
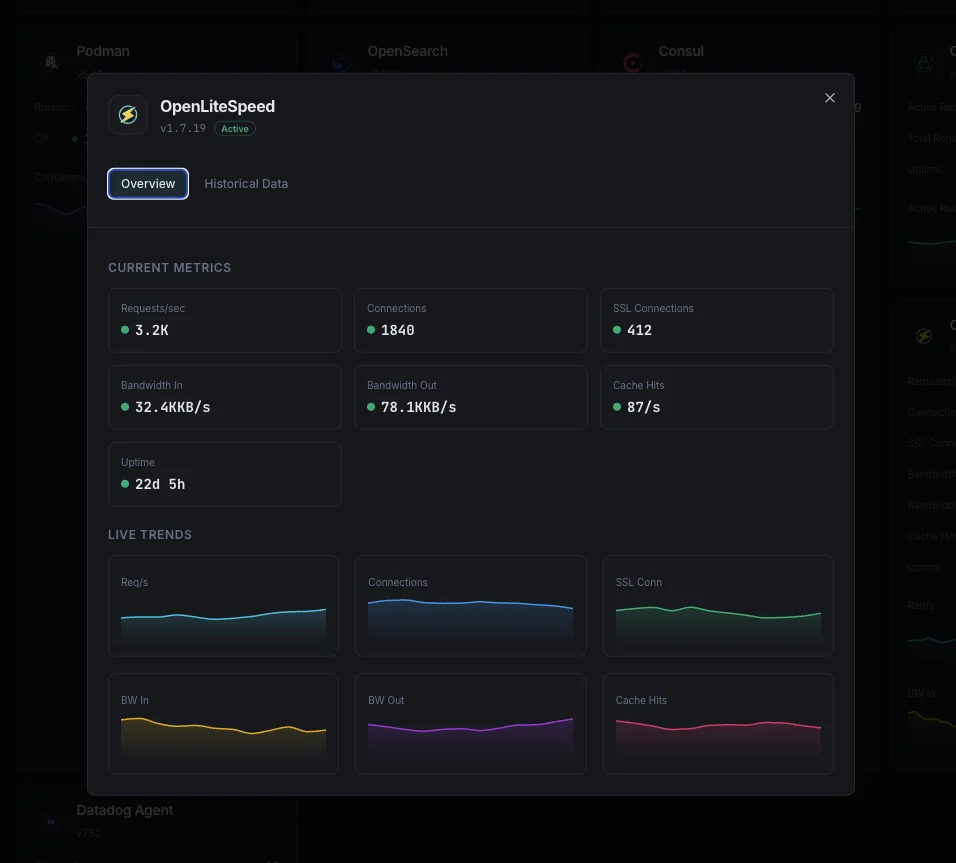
Why Choose Xitoring
Zero-config setup with instant metric collection and flexible alerting.
- One-command install
- 15+ global monitoring nodes
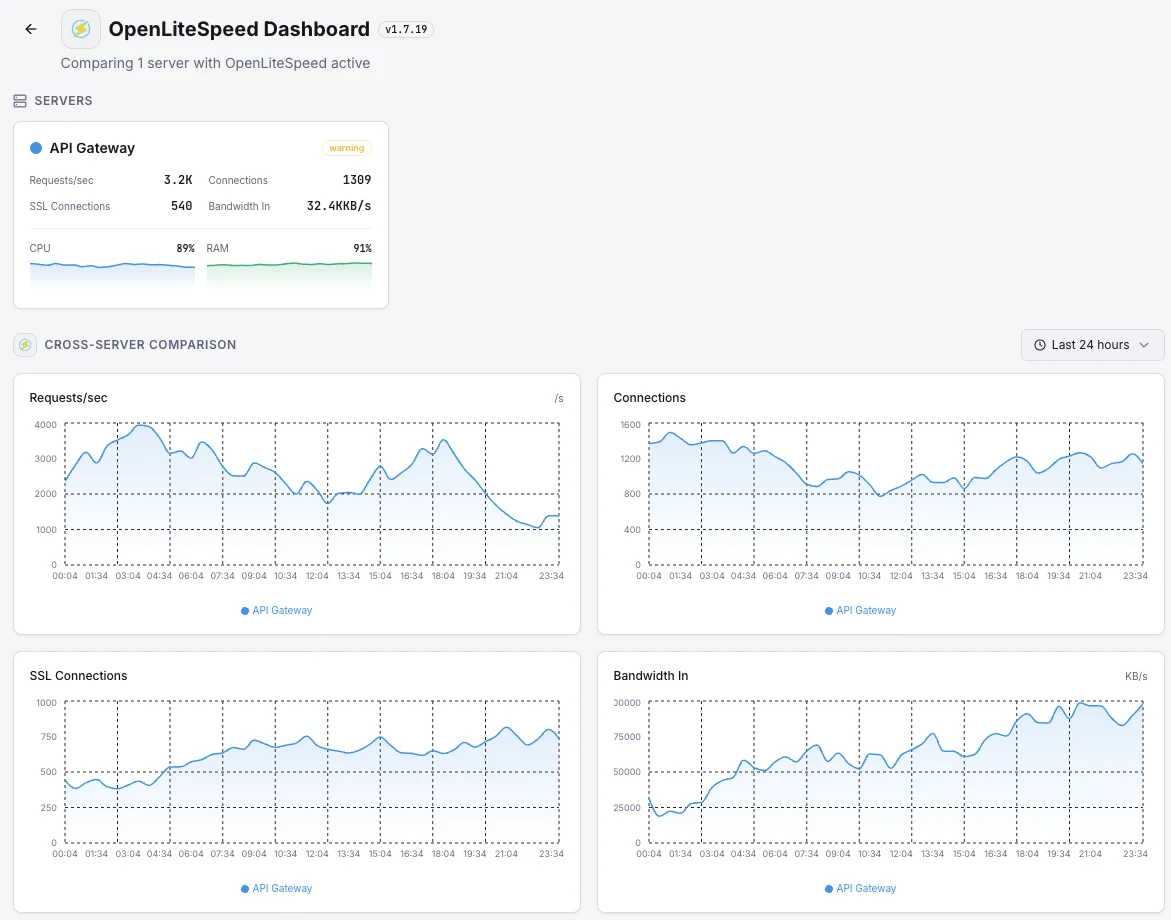
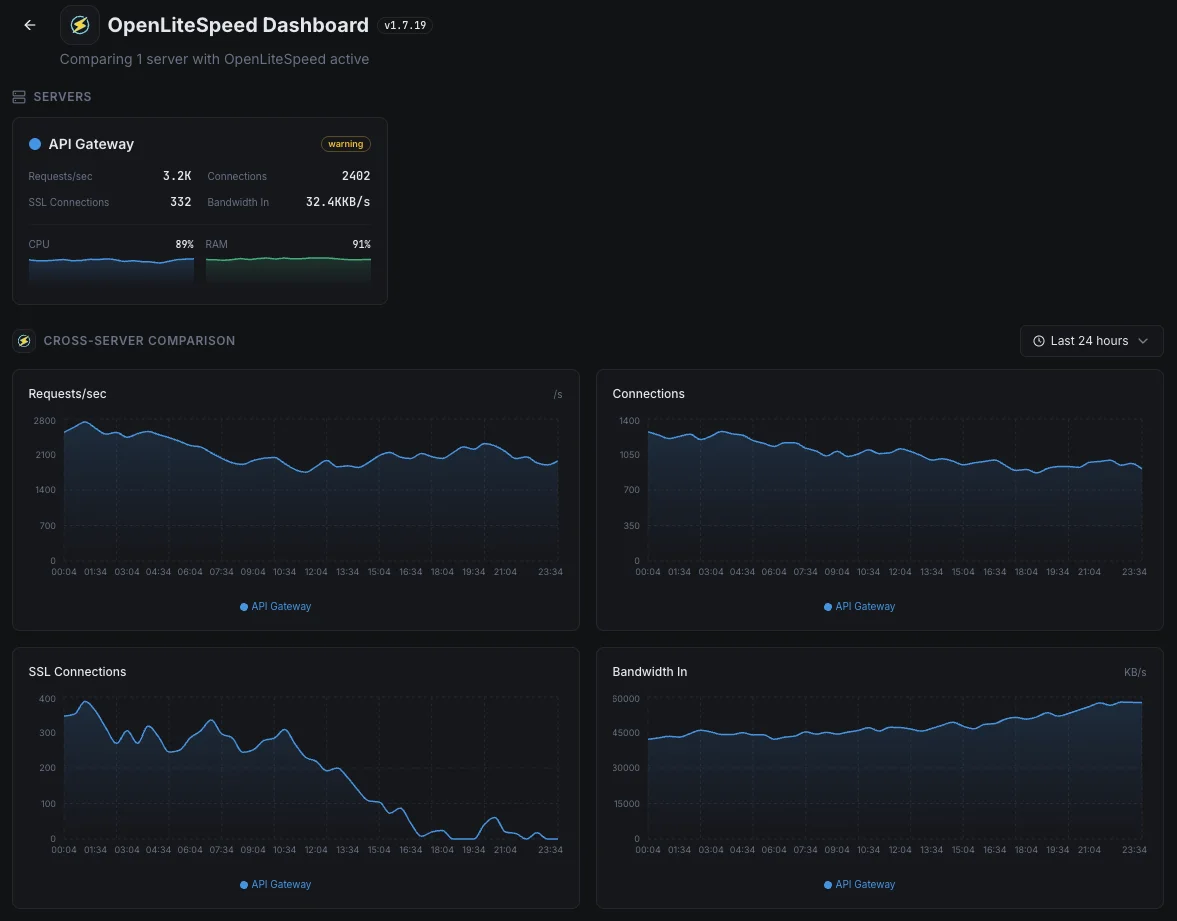
- Unified dashboard
- Multi-channel alerting
- Historical data retention
Common OpenLiteSpeed monitoring scenarios
Where OpenLiteSpeed typically runs today — and what could go wrong if no one's watching.
Fast WordPress sites
WordPress sites built on OpenLiteSpeed use its built-in caching to feel almost instant. When that cache stops working as expected, page speed drops and visitors quietly bounce. We catch the dip the moment it begins so search rankings and conversions aren't quietly hurt.
OpenLiteSpeed running inside containers
When the web server runs inside containers, the platform constantly moves it around — and one server can end up doing far more work than the others. We surface the imbalance so the team can rebalance before some visitors get a slower experience than others.
Busy online stores
Online stores hit the web server hardest at checkout — the exact moment a slow page costs real revenue. We watch the signals that show whether the store can handle a traffic spike so the team can prepare for promotions and sales with confidence.
Prerequisites for OpenLiteSpeed
Make sure you've got these in place — most installs are a 60-second job once they are.
- OpenLiteSpeed 1.x (current 2026 line) installed and running
- OpenLiteSpeed stats path accessible (default
/tmp/lshttpd/, or/dev/shm/ols/status/for RAM-disk setups) - Root access on the host to install Xitogent
Get started in minutes
Install Xitogent on your server
Install the lightweight Xitogent monitoring agent on the host running OpenLiteSpeed.
curl -s https://xitoring.com/install.sh | sudo bash -s -- --key=YOUR_API_KEYConfirm the stats path
OpenLiteSpeed writes runtime stats to `/tmp/lshttpd/` by default. Confirm that path exists and contains active stat files — Xitogent will prompt for it during integrate (defaults match).
sudo xitogent integrateEnable the OpenLiteSpeed integration
Use the Xitoring dashboard or CLI to enable the OpenLiteSpeed integration. Xitogent auto-detects your OpenLiteSpeed instance and configured virtual hosts.
Configure alert thresholds (optional)
Set custom thresholds for Request Rate, Cache Hit Ratio, or Response Time to catch traffic anomalies and cache regressions early.
Verify it's working
Run this command on the server to confirm Xitogent picked up the integration. Fresh metrics will start streaming to your dashboard within ~30 seconds.
sudo xitogent statusConsidering alternatives?
See how Xitoring stacks up against the alternatives for OpenLiteSpeed monitoring — flat pricing, deeper integrations, and one agent that covers your whole stack.



Frequently asked questions
What is OpenLiteSpeed monitoring?
OpenLiteSpeed vs LiteSpeed Enterprise — what's the difference for monitoring?
How do I enable Real-Time Stats in OpenLiteSpeed?
How do I monitor LSCache hit ratios on OpenLiteSpeed?
How do I monitor OpenLiteSpeed on CyberPanel?
Can I monitor OpenLiteSpeed in Docker or Kubernetes?
Will Xitogent affect OpenLiteSpeed performance?
Can I integrate OpenLiteSpeed with Prometheus or Grafana?
What OpenLiteSpeed versions are supported?
Start monitoring OpenLiteSpeed today
Set up in under 60 seconds. No credit card required. Full metrics from day one.
Start Free Trial