PostgreSQL Monitoring
Monitor PostgreSQL TPS, cache hit ratio, replication lag, idle-in-transaction sessions, autovacuum progress, and WAL generation in real time — agent-based via `pg_stat_*` views.
Why monitor PostgreSQL?
PostgreSQL handles your transactional data — and quietly accumulates problems that surface as outages weeks later: replication drift, bloated tables, runaway autovacuum, idle-in-transaction sessions holding locks. Monitoring catches the signals early so you fix the root cause before a customer ticket forces emergency `VACUUM FULL` at 3am.
PostgreSQL monitoring, explained
PostgreSQL monitoring catches replication drift, runaway autovacuum, bloated tables, and idle-in-transaction sessions before they turn into outages or data corruption. For any Postgres workload — RDS, Aurora, CloudNativePG, self-hosted Patroni clusters — per-database visibility is the difference between catching a connection leak in 60 seconds and learning about it from a customer ticket. Xitoring auto-discovers your Postgres, queries the native pg_stat_* views with the pg_monitor role, and routes alerts to Slack, PagerDuty, Telegram, or your existing on-call.
What we monitor
Active Connections
Number of currently active connections to the PostgreSQL server.
Transactions per Second
Rate of committed and rolled-back transactions.
Tuple Operations
Rate of inserted, updated, deleted, and fetched tuples across all databases.
Dead Tuples
Number of dead tuples waiting for vacuum, indicating potential table bloat.
Cache Hit Ratio
Percentage of data requests served from shared buffers without disk access.
Replication Lag
Bytes or seconds behind the primary in streaming replication.
WAL Generation Rate
Rate of Write-Ahead Log data being generated.
Lock Waits
Number of queries waiting to acquire locks on database objects.
Temp Files Created
Number and size of temporary files created for query processing.
Database Size
Total disk space used by each database including indexes.
Idle in Transaction
Connections that are idle inside an open transaction, potentially holding locks.
Checkpoints
Frequency and duration of checkpoint operations.
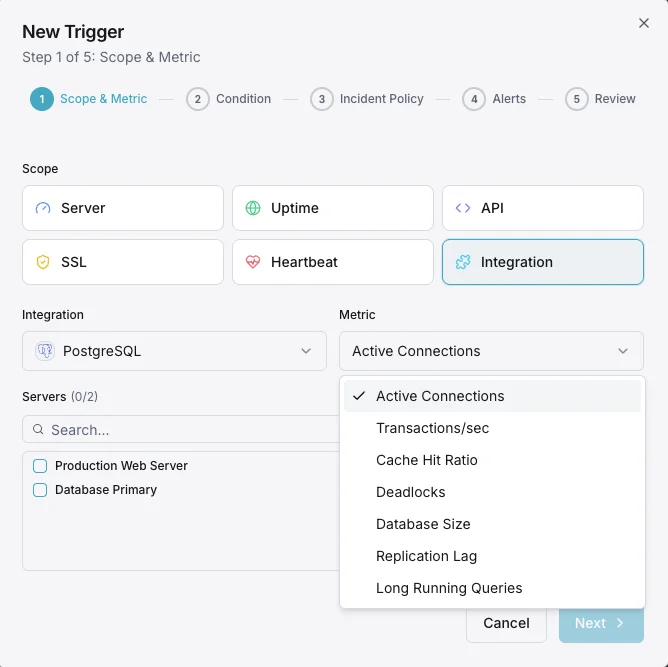
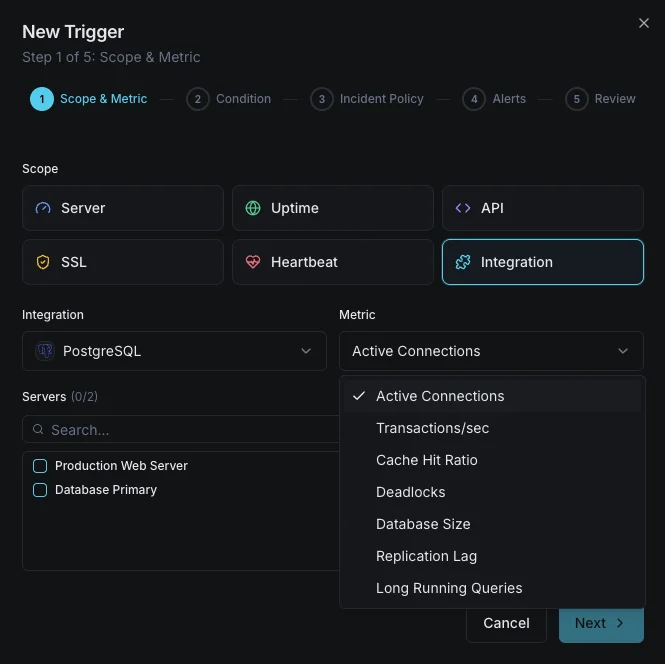
Configurable alert triggers
Set up custom triggers in your dashboard to get notified the moment PostgreSQL metrics cross your defined thresholds.
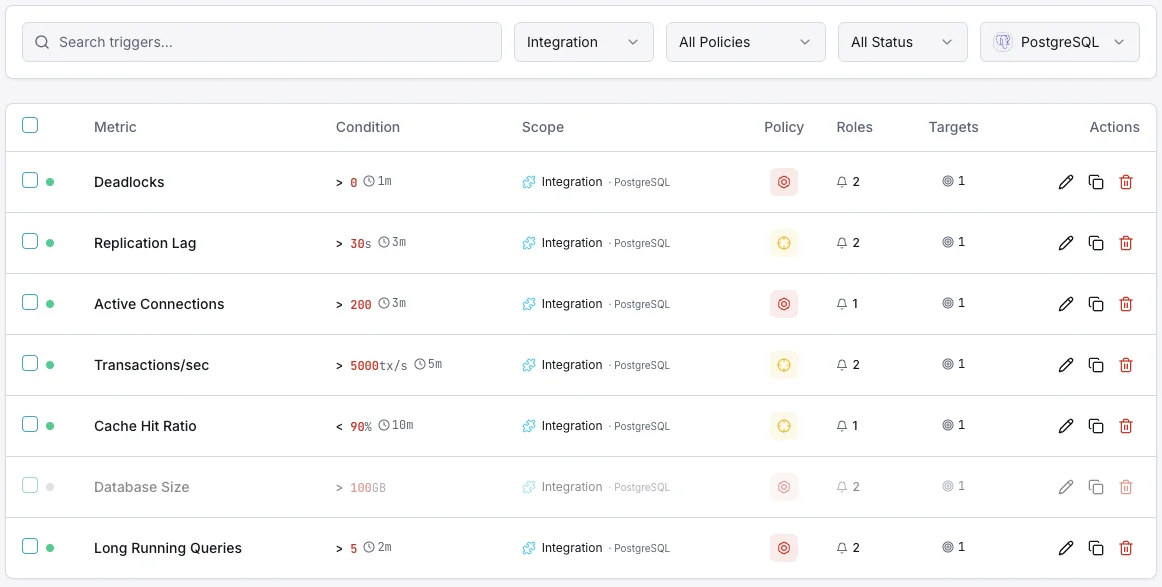
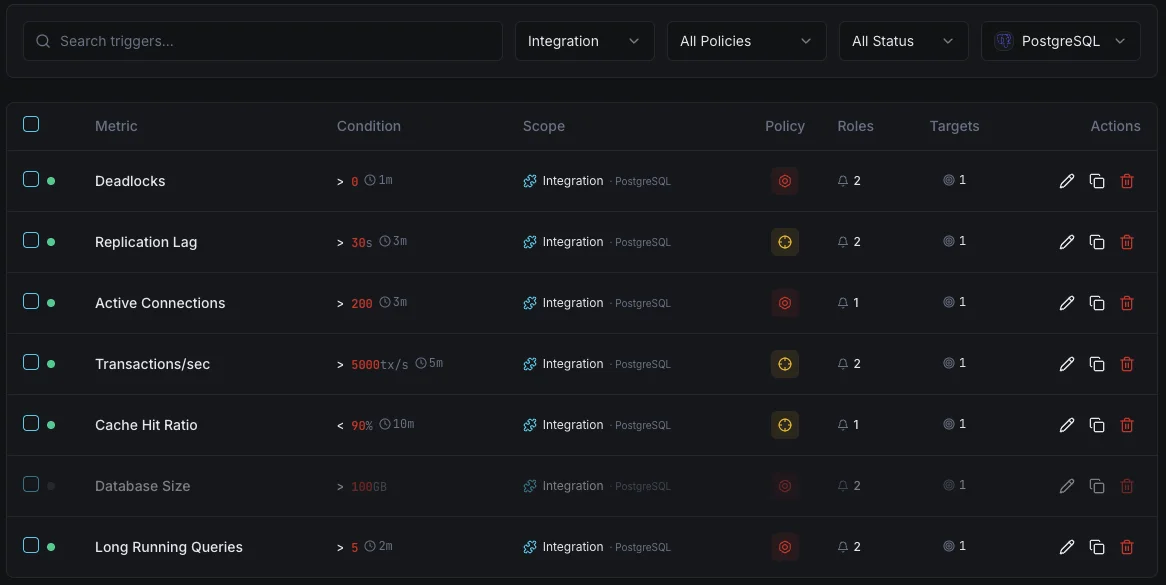
Active Connections
criticalFires when active connections approach max_connections, risking new connection refusal and application errors.
Replication Lag
criticalTriggers when streaming replication falls behind, risking data inconsistency between primary and replicas.
Dead Tuples
warningAlerts when dead tuple count grows beyond threshold, indicating vacuum is falling behind and table bloat is increasing.
Cache Hit Ratio
warningFires when cache hit ratio drops below threshold, indicating excessive disk I/O and potential memory pressure.
Lock Waits
warningTriggers when queries are blocked waiting for locks, indicating contention that degrades performance.
Transaction Rate Drop
criticalAlerts when transaction throughput drops significantly, indicating a potential database hang or performance issue.
Importance of PostgreSQL Monitoring
PostgreSQL handles mission-critical data for enterprises worldwide. Without proper monitoring, table bloat, replication drift, and connection exhaustion can lead to data corruption, outages, and unrecoverable failures.
- Detect long-running queries and lock contention early
- Prevent table bloat with vacuum performance tracking
- Monitor streaming replication for data consistency
- Identify connection leaks before pool exhaustion
- Track WAL generation for storage capacity planning
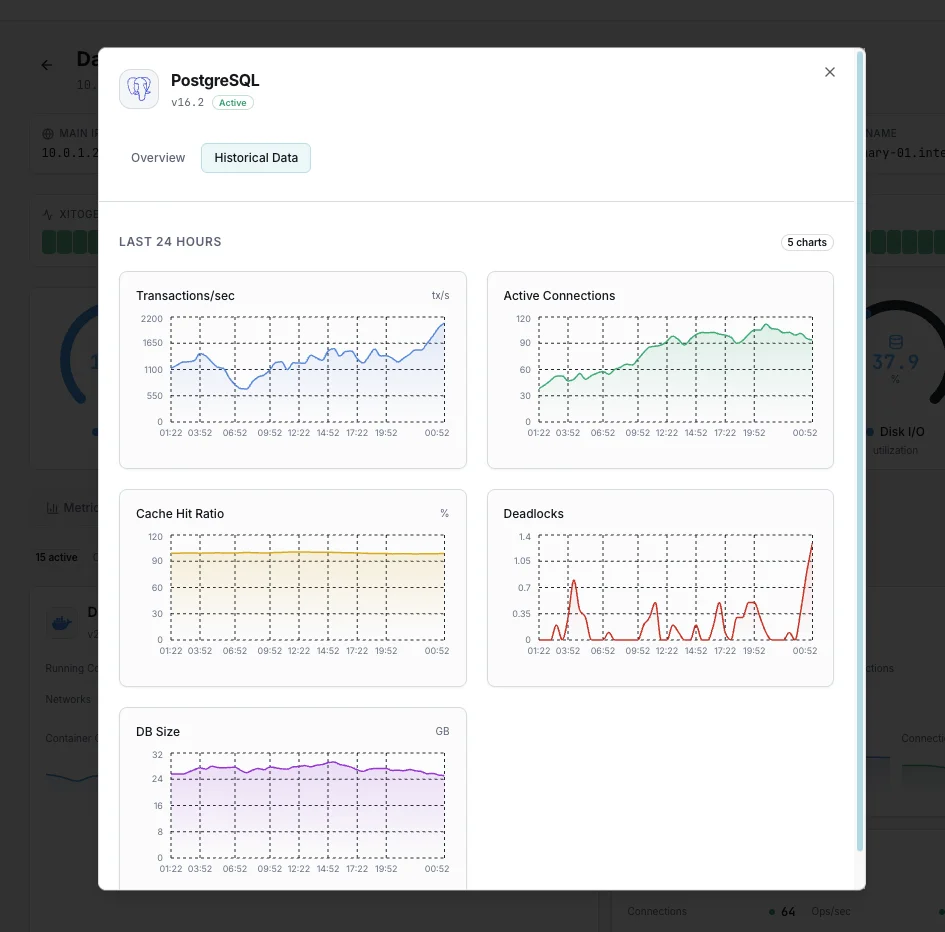
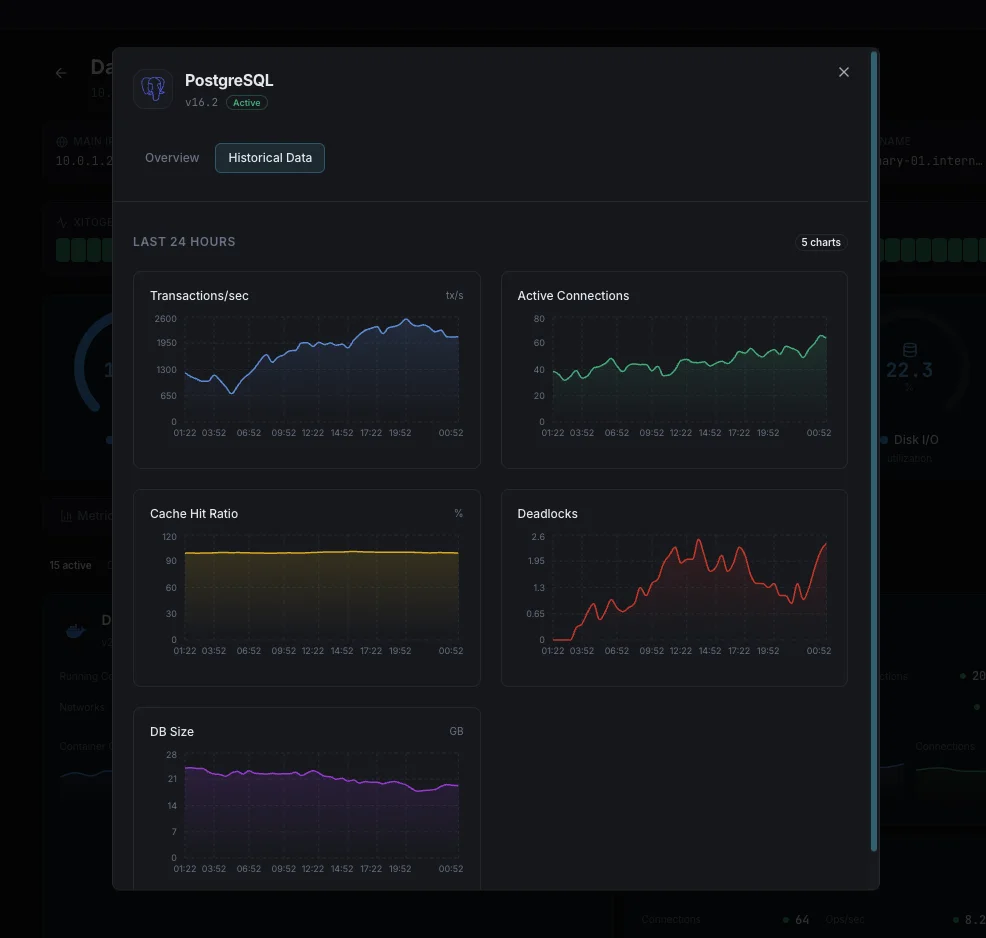
Why Choose Xitoring
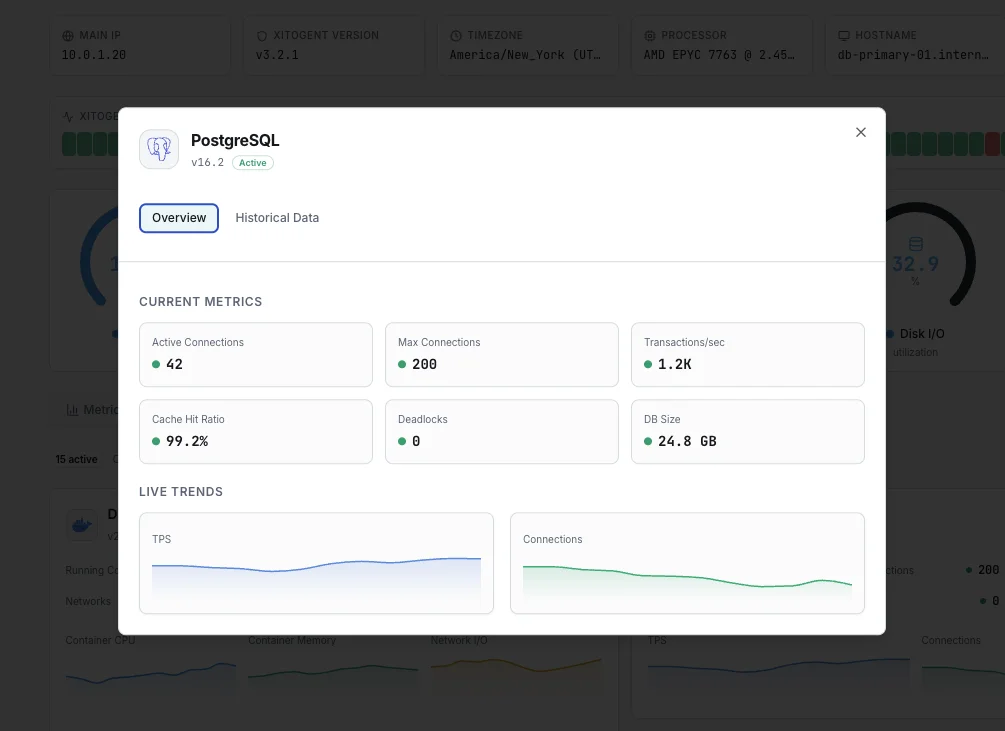
Xitoring delivers enterprise-grade PostgreSQL monitoring with zero-config setup. Our lightweight agent auto-discovers your PostgreSQL instances, starts collecting metrics in under 60 seconds, and integrates with your existing notification channels.
- One-command install — no complex YAML or config files
- 15+ global monitoring nodes for low-latency checks
- Unified dashboard for servers, databases, and uptime
- Flexible alerting via Slack, PagerDuty, Telegram & more
- Historical data retention for capacity planning & audits
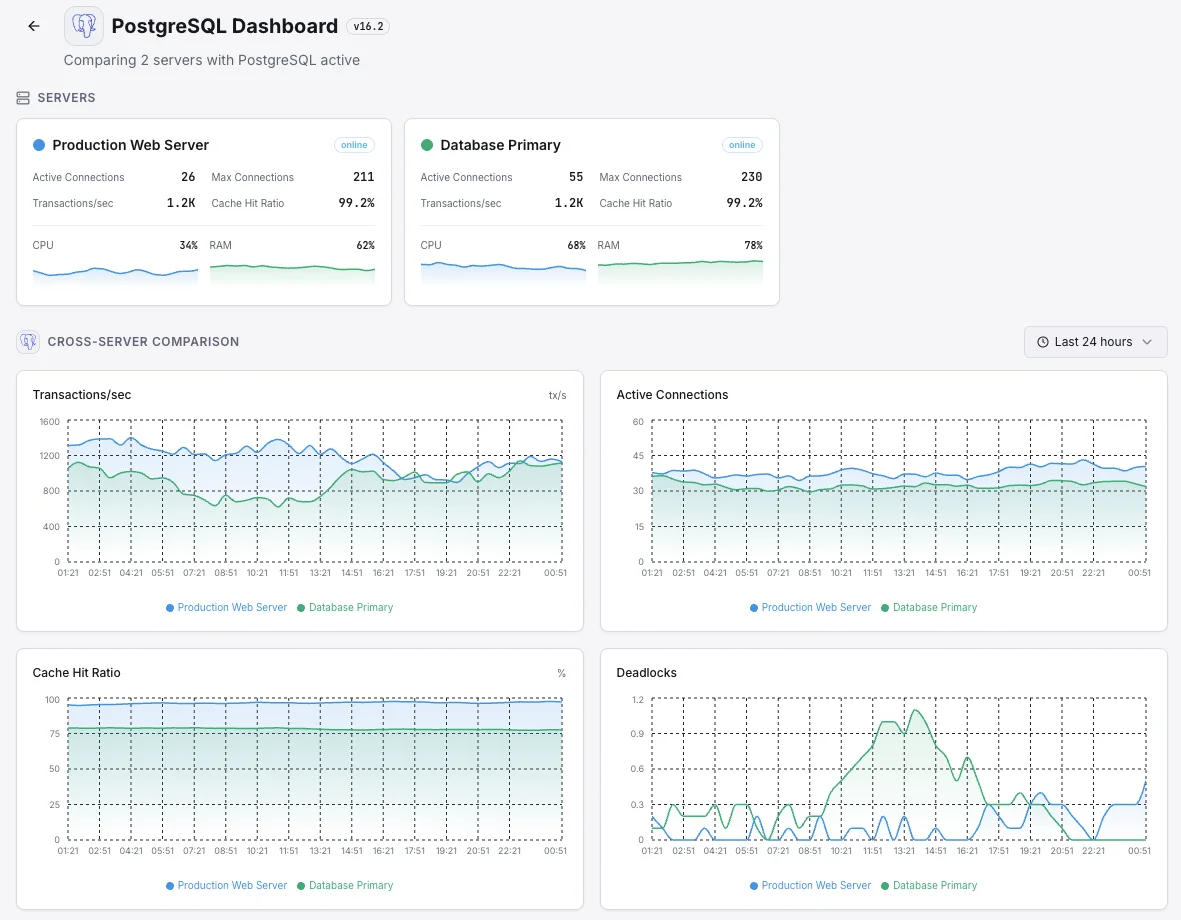
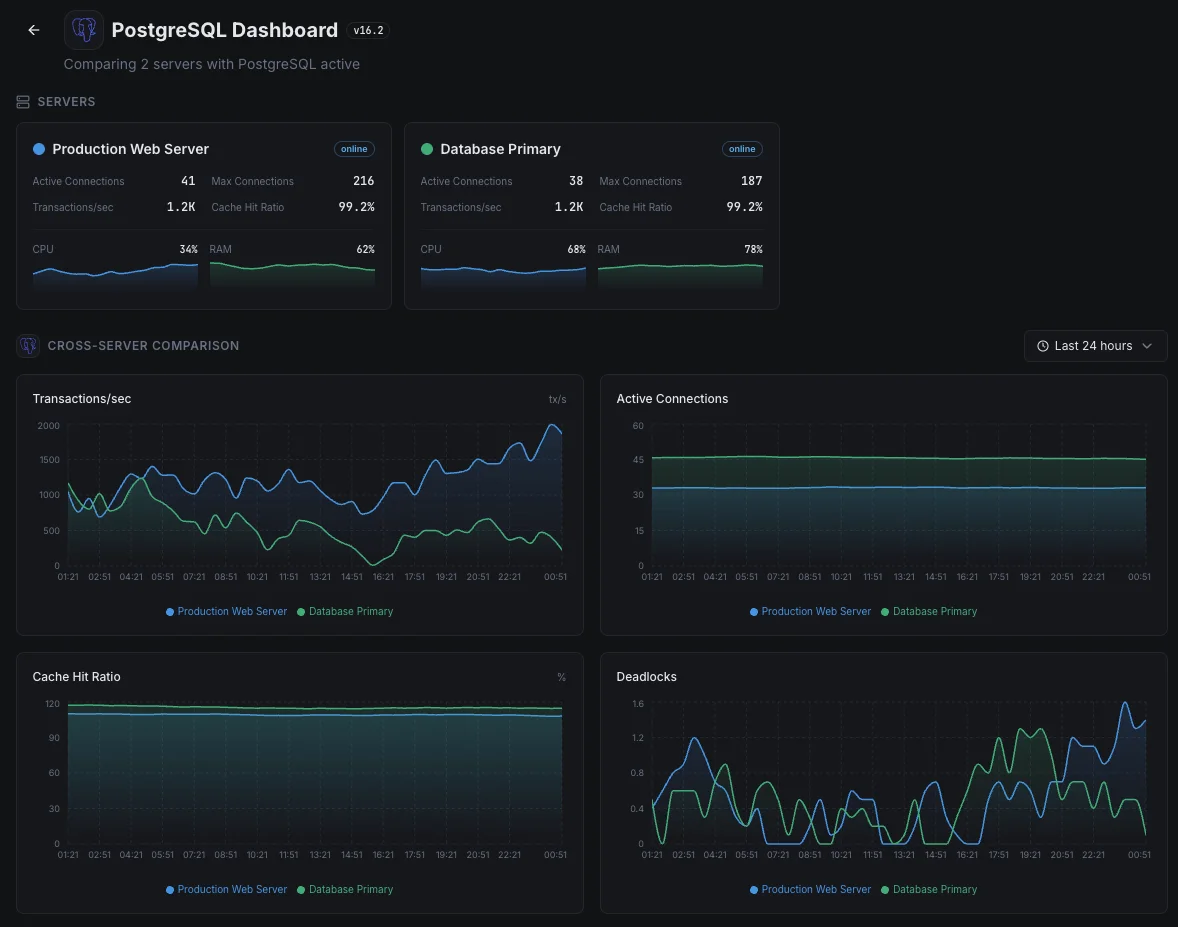
Common PostgreSQL monitoring scenarios
Where PostgreSQL typically runs today — and what could go wrong if no one's watching.
Managed cloud database (AWS, Azure, Google)
Cloud providers handle backups and patching, but they don't tell you when your own queries are slow, your connections are running out, or a backup copy is quietly falling behind the live one. We catch the issues the provider leaves to you, so an outage doesn't catch the team off guard.
Self-hosted database with automatic failover
If the main database fails, a backup copy is supposed to take over in seconds. But a backup that's quietly falling behind can turn that handoff into a 30-second outage — or worse, data loss. We watch every copy so you know it's truly ready to take over before you ever need it to.
Database running inside Kubernetes
Databases in Kubernetes get moved, restarted, and updated by the platform automatically. Most of the time it's safe — when it isn't, you usually find out from frustrated users. We surface the early warning signs so the team can step in before a routine update becomes an incident.
Prerequisites for PostgreSQL
Make sure you've got these in place — most installs are a 60-second job once they are.
- PostgreSQL 12 or later (tested through PG 18 in 2026) running on the server
- A user with the
pg_monitorrole (or equivalentSELECTgrants onpg_stat_*views) - Optional:
pg_stat_statementsloaded viashared_preload_librariesfor query-level metrics
Get started in minutes
Install Xitogent on your server
If you haven't already, install the lightweight Xitogent monitoring agent on your server.
curl -s https://xitoring.com/install.sh | sudo bash -s -- --key=YOUR_API_KEYCreate a monitoring user in PostgreSQL
Create a dedicated read-only user for Xitogent to collect metrics:
CREATE USER xitoring WITH PASSWORD 'your_secure_password';
GRANT pg_monitor TO xitoring;
GRANT SELECT ON pg_stat_database TO xitoring;Enable the PostgreSQL integration
Use the Xitoring dashboard or CLI to enable the PostgreSQL integration with the monitoring credentials.
sudo xitogent integrateConfigure alert thresholds (optional)
Set custom thresholds for metrics like replication lag, dead tuples, or connection count to get notified when something needs attention.
Verify it's working
Run this command on the server to confirm Xitogent picked up the integration. Fresh metrics will start streaming to your dashboard within ~30 seconds.
sudo xitogent statusConsidering alternatives?
See how Xitoring stacks up against the alternatives for PostgreSQL monitoring — flat pricing, deeper integrations, and one agent that covers your whole stack.



Frequently asked questions
What is PostgreSQL monitoring?
How do I monitor PostgreSQL cache hit ratio?
What is pg_stat_statements and how do I enable it?
How do I detect slow queries in PostgreSQL?
How do I monitor PostgreSQL replication lag?
What is autovacuum and why does it matter?
How do I monitor connection pool exhaustion and idle-in-transaction sessions?
Does this work with managed PostgreSQL (RDS, Cloud SQL, Azure)?
What PostgreSQL versions are supported?
Start monitoring PostgreSQL today
Set up in under 60 seconds. No credit card required. Full metrics from day one.
Start Free Trial