Modern infrastructure is distributed, fast-moving, and increasingly complex. DevOps engineers are expected to deploy faster, detect issues earlier, automate responses, and ensure systems stay reliable — all while keeping cloud costs sane. Monitoring is no longer a “nice-to-have” tool running in the background. In 2025, a great monitoring stack is a first-class component of your infrastructure.
But here’s the truth:
Most companies don’t have a unified monitoring strategy — they have tool chaos.
Five dashboards, three alert systems, two clouds, and still nobody notices the CPU spike until the customer opens a support ticket.
This article helps you build a complete monitoring stack step-by-step — one that helps DevOps teams detect, diagnose, and react to problems before users even notice.
What We’ll Cover
-
Why monitoring matters more than ever in 2025
-
The 6 pillars of a perfect monitoring stack
-
Best-fit tools (open-source + SaaS) for each layer
-
Automation & AIOps for faster incident response
-
Real example workflows using Xitoring
-
Best practices for building a future-proof observability culture
Grab your coffee — let’s design the perfect monitoring ecosystem.
Why Monitoring Matters More Than Ever in 2025
Infrastructure trends are shifting:
| Trend | Result |
|---|---|
| Microservices > Monoliths | More distributed failure points |
| Multi-cloud adoption | Harder visibility & metrics correlation |
| Remote teams & global systems | Need 24/7 monitoring & automation |
| AI-powered users & workloads | Higher performance sensitivity |
| Uptime expectations near 100% | Incidents cost more than ever |
Even small outages hurt. A few minutes of downtime during checkout can cost an eCommerce store thousands. A performance degradation in a SaaS app directly affects churn. And for services with SLAs, downtime = money out of the pocket.
Monitoring isn’t just about uptime anymore — it’s about:
✔ Performance optimization
✔ User experience protection
✔ Fast incident response
✔ Predictive failure detection
✔ Data-driven engineering decisions
Your monitoring stack is your early warning system, your forensic lab, and your operations assistant — all in one.
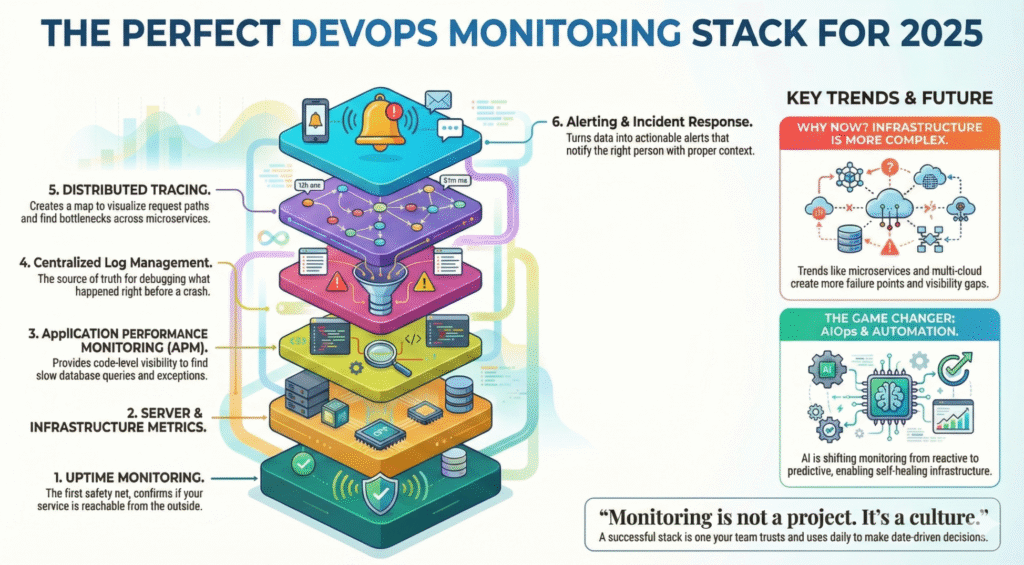
The 6 Pillars of a Perfect Monitoring Stack
A mature monitoring setup includes multiple layers working together:
-
Uptime Monitoring & Status Checking
-
Server & Infrastructure Metrics
-
Application Performance Monitoring (APM)
-
Logs & Centralized Log Management
-
Tracing & Distributed Observability
-
Alerting, Incident Response & Automation
Most failures don’t happen in isolation — so a good stack correlates metrics across all layers.
Let’s break these down one by one.
1. Uptime Monitoring — The First Safety Net
Uptime checks confirm whether your service is reachable from the outside. This is critical for:
-
Availability tracking
-
SLA reporting
-
Detecting DNS/SSL/network issues
-
Early outage detection before customers notice
Your uptime monitor should:
-
Ping from multiple global locations
-
Support HTTP, TCP, ICMP, DNS & port checks
-
Alert instantly when downtime starts
-
Provide public/private status pages
-
Track historical uptime & incidents
Good Tools:
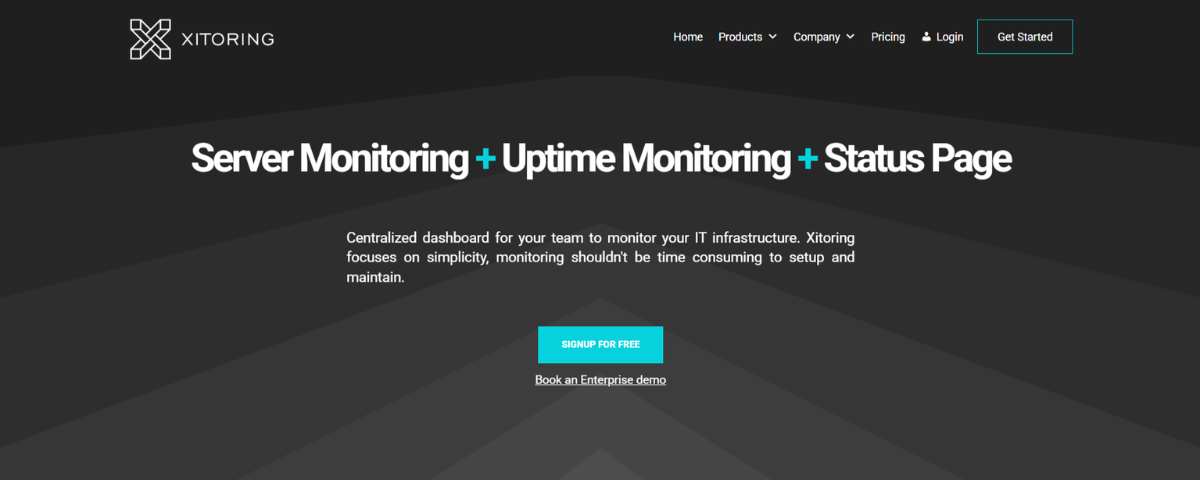
🔹 Xitoring (Uptime + server monitoring in one platform)
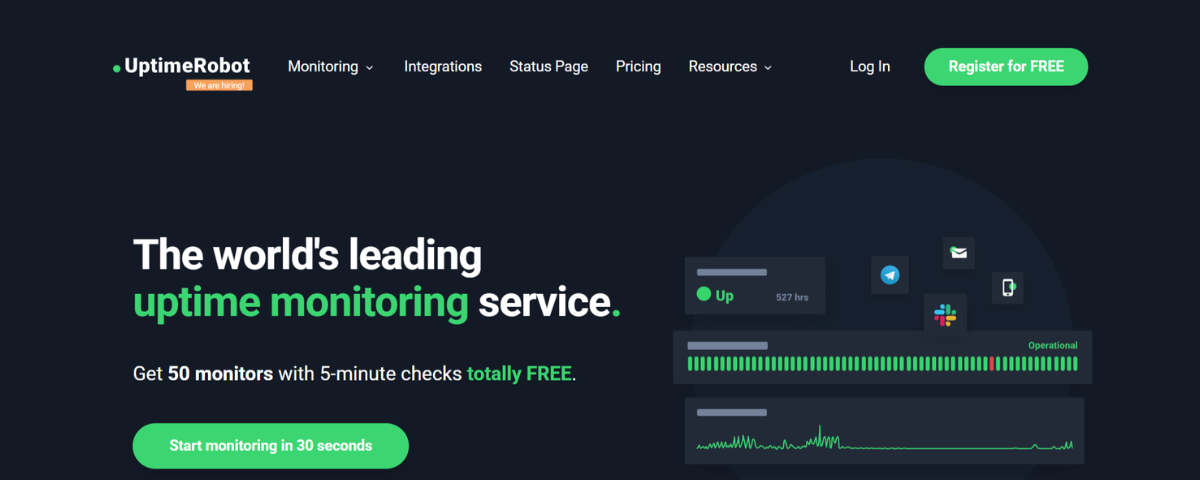
🔹 UptimeRobot, Pingdom, BetterUptime
🔹 DIY with Prometheus + Blackbox Exporter
Example Workflow with Xitoring:
You configure uptime checks for APIs and landing pages. Xitoring monitors from global nodes every minute and instantly alerts via Slack/Telegram if latency spikes or the endpoint becomes unreachable. The status page updates automatically — no manual comms required.
2. Server & Infrastructure Monitoring
This is where you track CPU, RAM, load average, disk IO, network throughput, system logs, and more.
Why it matters:
Many outages start here — memory leaks, full disks, CPU throttling, kernel issues, resource exhaustion.
A server monitoring tool in 2025 should provide:
✔ Metric collection & dashboards
✔ Threshold-based & anomaly alerts
✔ Process/service monitoring
✔ Linux + Windows support
✔ Agent or agentless collection
Tools to Consider:
Open-source: Prometheus + Node Exporter, Zabbix, Grafana
SaaS: Datadog, New Relic, Xitoring for real-time insights
Where Xitoring fits:
Xitoring installs a lightweight agent, monitors Linux/Windows metrics, and uses AI pattern detection to warn you about unusual performance behaviors before they cause downtime.
3. Application Performance Monitoring (APM)
Even if servers look healthy, your application might be struggling.
APM provides:
-
Code-level performance traces
-
Slow endpoint/database query detection
-
Memory leaks & exception tracking
-
End-to-end latency breakdowns
If your application scales fast or spans micro-services, APM isn’t optional — it’s survival.
4. Logs — The Source of Truth During Incidents
When something breaks, engineers run to dashboards… and then eventually to logs.
Centralized logging helps answer:
-
What happened before the crash?
-
Which service threw the exception?
-
Did the deploy introduce a bug?
-
Is it a system issue or an external dependency?
Log Stack Examples:
-
ELK (Elasticsearch + Logstash + Kibana) — flexible, widely used
-
Grafana Loki — cheaper & scalable
-
Graylog, Splunk — enterprise search capabilities
-
Cloud native logs — GCP Logging, AWS CloudWatch
Logging must be centralized; SSH-ing into servers to tail logs is a 2010 problem.
5. Distributed Tracing — Understanding System Behavior
When requests pass through queues, services, load balancers, and databases — tracing is your map.
Distributed tracing helps:
✔ Visualize request paths
✔ Identify bottlenecks across microservices
✔ Debug timeouts, retries, failures
Standards & Tools:
-
OpenTelemetry (industry standard)
-
Jaeger, Zipkin
-
AWS X-Ray / GCP Cloud Trace
Tracing ties APM + logs + metrics together to reveal the full picture of an incident.
6. Alerting & Incident Response
Monitoring is useless without actionable alerts. No one wants alert fatigue, but silence during outages is even worse.
A modern alerting workflow should:
-
Detect
-
Notify the right person
-
Provide context (dashboards, logs)
-
Trigger automated remediation when possible
Alert Channels:
-
Slack, Teams, Email
-
PagerDuty / OpsGenie
-
Telegram, SMS
-
Webhooks for automation
Xitoring Example:
When CPU stays above 90% for 10 minutes, Xitoring sends alerts via Slack and Telegram, attaches system metrics, and can trigger automated scripts (e.g., restart a service or scale pods).
AIOps & Automation — The 2025 Game Changer
Monitoring evolution is moving from reactive → predictive.
AI can help detect:
-
Unusual traffic spikes
-
Slow memory leaks
-
Latency changes before user impact
-
Behavior trends that lead to failure
Platforms like Xitoring already integrate AI-based anomaly detection, enabling:
🔹 auto-alerting before outages
🔹 suggestion of root causes
🔹 automated recovery triggers
The future is self-healing infrastructure.
Best Practices for DevOps Teams in 2025
-
Alert on symptoms, not noise
CPU spike alone isn’t a problem — a spike + latency increase is. -
Use status pages
Reduces support load and builds trust with customers. -
Track SLO/SLI metrics
Reliability is measurable, and you can improve only what you track. -
Observe deployments closely
Most incidents are human releases. -
Monitoring is not a project. It’s a culture.
Final Thoughts
A perfect monitoring stack doesn’t mean buying the most expensive tool or over-engineering your observability pipeline. It means combining layers that give you visibility from user request → server → application → logs → root cause.
If there’s one takeaway:
Monitoring shouldn’t tell you something went wrong — it should tell you why and how to fix it fast.
Whether you choose an open-source stack, enterprise platform, or a unified solution like Xitoring that combines uptime + server monitoring with AI insights, the key is building a system your team trusts and uses daily.