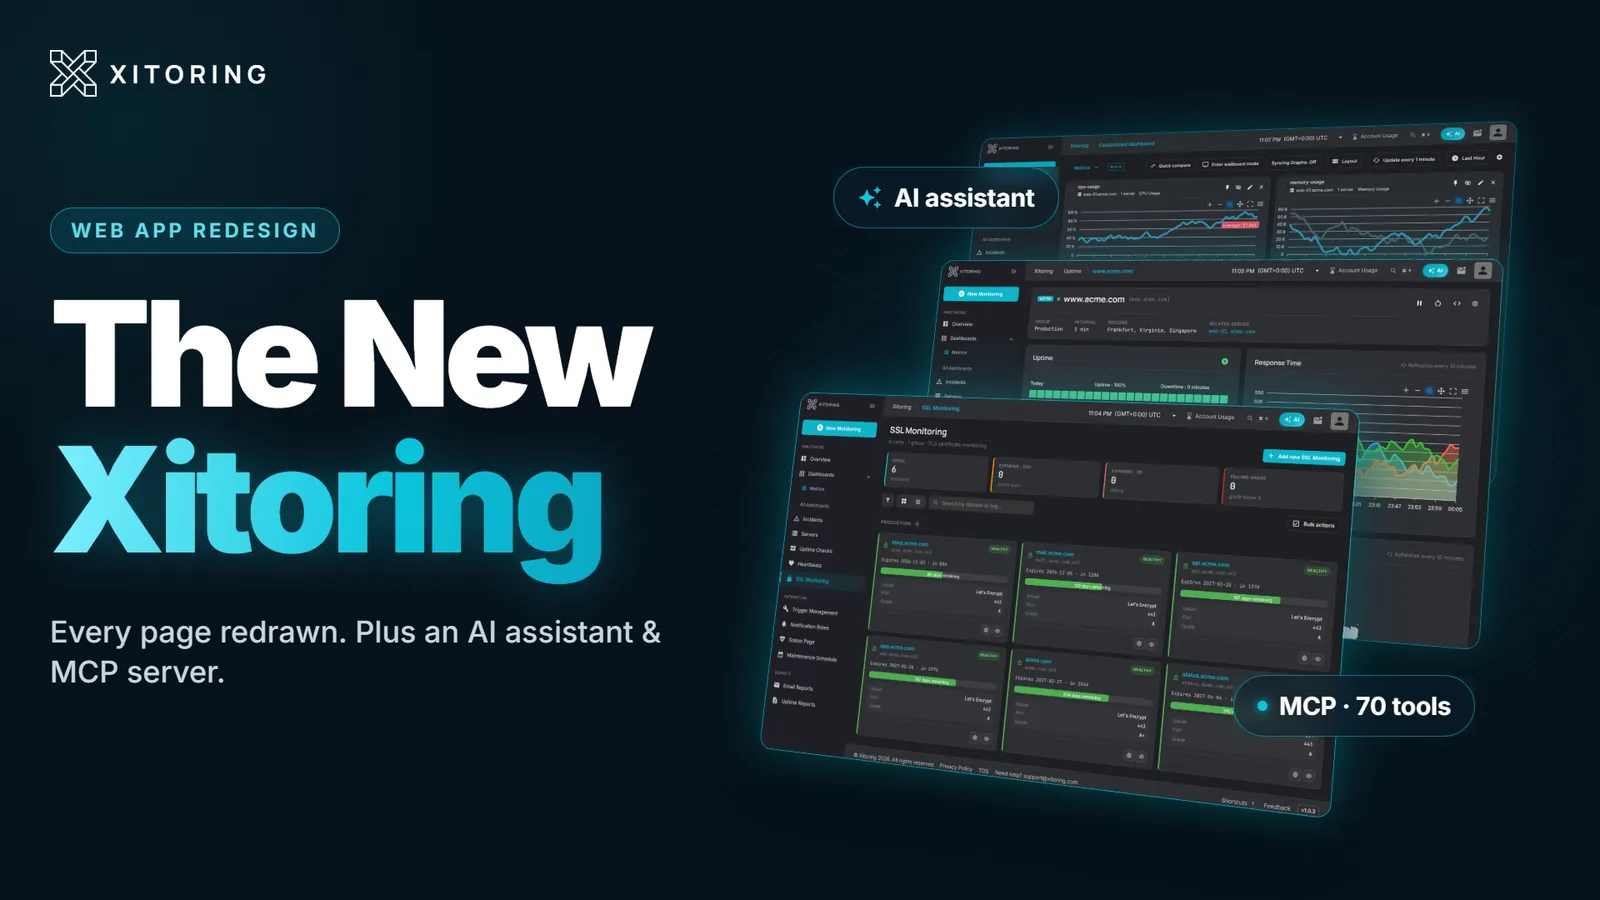
Xitoring 3.0 shipped on September 3, 2026, and it's the biggest release we've made: every page and component in the web app was rebuilt on a new design system. Not restyled: redesigned, starting from the question of what you actually look at when you open each page and what you're trying to do there. If you've been using Xitoring for a while, the app you log into this month is a different product from the one you signed up for.
3.0 is also where a year of work comes together. Releases 2.37 through 2.39 redesigned the panel one page at a time, and 2.40 added the AI assistant and the MCP server. 3.0 finishes the job: every page on the same design system, the assistant reimagined, and a few things that are new outright, like anomaly detection and chat history.
Rather than write a changelog, we recorded a walkthrough. The video below goes through the whole panel in the order you'd use it — dashboard, servers, uptime checks, incidents, heartbeats, SSL, status pages, maintenance, notifications, graphs and dashboards — and finishes with the AI side of the product: the in-panel assistant and the MCP server.
The rest of this post covers the same ground, with the reasoning behind each change. The redesign is live on every plan, including the free one.
Xitoring 3.0 at a glance
- Every page rebuilt on one design system, with a simplified sidebar, skeleton loading states, keyboard shortcuts throughout, and accessibility improvements across the app.
- Redesigned core pages: the dashboard and finalized custom dashboards, server overview (new vitals hero and a Triggers tab), uptime checks, heartbeats, notification roles, maintenance, billing, profile and contacts.
- Status pages with a six-layout picker and color presets.
- The AI chat assistant, reimagined, with rich answers, inline references and chat history.
- AI/ML anomaly detection, with automatic anomaly scoring and health summaries for servers.
- A new first-run experience: redesigned login and registration, a reset-password flow, post-registration onboarding, and a New Monitoring wizard with an account setup score.
What we were trying to fix
Xitoring grew feature by feature. Server monitoring came first, then uptime checks, then SSL, heartbeats, integrations, status pages, custom dashboards, incidents, maintenance, and 20-plus notification channels. Each landed on the page that made sense at the time. The result was a panel where everything existed but nothing was where you'd guess, tables that had grown a column per release, and forms with fields nobody had touched since 2023. The page-by-page redesigns in 2.37 through 2.39 fixed the worst of it, but a panel redesigned one page at a time still feels like several products stitched together.
The redesign had four rules:
- Every page opens on the thing you came for. A server overview leads with health, not metadata. The uptime page leads with what's down.
- Lists have to scale. Ten checks and a thousand checks need different views, not the same table stretched thinner.
- Fewer clicks between noticing and acting. Bulk actions, inline triggers, quick search and keyboard shortcuts everywhere.
- One design system, everywhere. Tables, filters, bulk actions, loading and empty states are built from the same components on every page, so once you've learned one list you've learned all of them.
Here's how that played out.
Main dashboard
The dashboard is the first thing you see, so it got the most attention. Widgets were rebuilt from scratch: the overall check-status widget, checks with the most downtime, incident widgets, SSL expiry, and recent sessions all share one card style and load independently, so the page paints quickly even on large accounts. Widgets are draggable, and the redesigned drag handles make rearranging the layout something you'll actually do rather than something you'll tolerate.
Around it, the sidebar was simplified, the theme switcher lives in the redesigned profile dropdown, and pages show skeleton placeholders while they load, so "still loading" and "nothing here" no longer look the same. Uptime and heartbeat data load noticeably faster — partly the new UI, partly caching that cuts repeated requests.
Servers
The server list has quick search, OS and group filters, disk I/O columns, and a compact list mode next to the card view. Labels sort properly. Outdated Xitogent versions are flagged without crashing the page, which — we'll admit — was not always true.
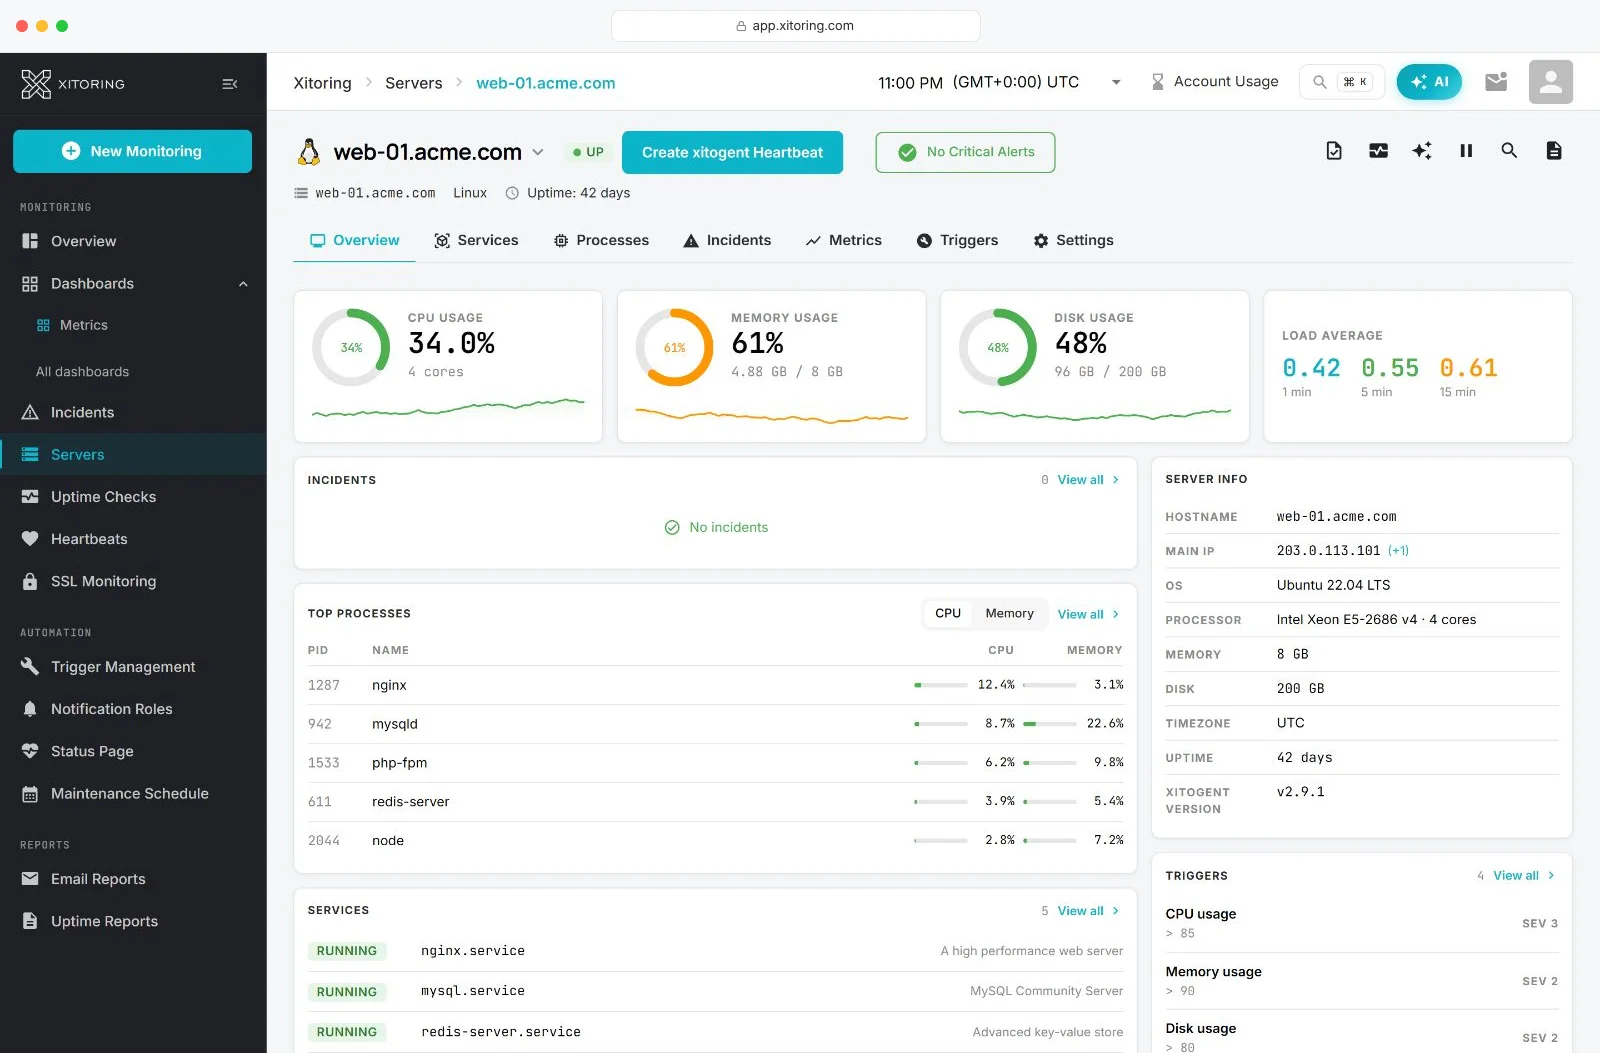
The server overview is the biggest single-page change. It opens on a new vitals hero — CPU, memory, disk and load average at a glance — followed by incidents, top processes, running services, server info and triggers, with services, processes, incidents, metrics, triggers and settings each a tab away. Triggers can be created directly from a graph: click the point you care about, set the condition, done. The trigger editor itself was rebuilt with a clearer summary of what will fire and when, and it asks for confirmation before deleting.
Adding a server starts from the redesigned New Monitoring wizard, the entry point for adding any kind of monitor, which now includes an account setup score gauge showing how complete your setup is. The server form itself is shorter: the region selector is gone (it's handled automatically), the Xitogent key selection is clearer, and the install command is one copy.
Integrations — Nginx, Apache, MySQL, PostgreSQL, Redis, Docker, RabbitMQ, HAProxy and the rest of the 30-plus — are enabled from the panel in two clicks, no sudo xitogent integrate required, and the recent additions (Dovecot, Exim, Postfix, CoreDNS, OpenVPN, WireGuard) work the same way. Docker monitoring shows container status and proper units on network and block I/O.
Uptime checks
This is the page most accounts live in, and it's where "lists have to scale" mattered most. In 3.0 it's also purely uptime: heartbeats moved out to a section of their own (more on that below).
There are three ways to look at your checks: the full table, a compact list, and a grid view that lays checks out as blocks so you can scan a few hundred at a glance and spot the red ones. Summary cards across the top count total, up, down and paused checks alongside the 30-day average uptime. The table got significantly faster on large accounts.
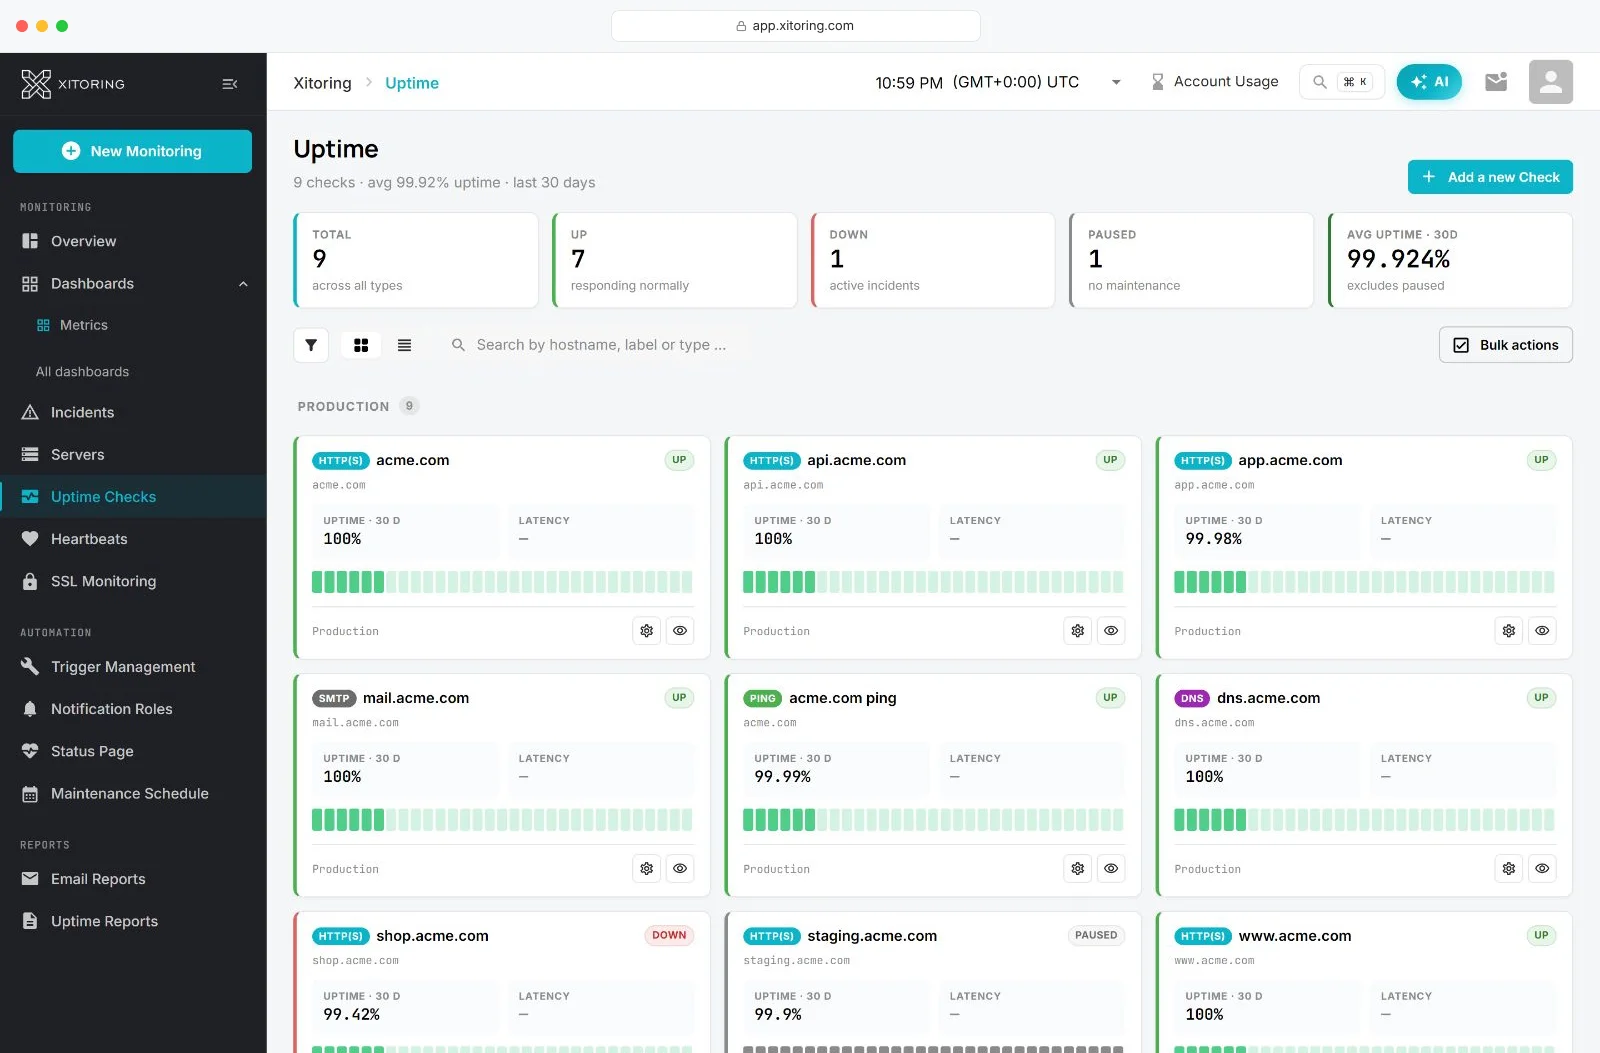
Bulk actions cover almost everything: pause, unpause, delete, move to group, add to status page, add to maintenance, and change intervals, regions and incident policies across a selection in one go. In 3.0 bulk actions work the same way on every list page, not just this one.
Creating a check was streamlined end to end. Paste a cURL command and the HTTP parser turns it into a check with headers, method and body already filled. Labels are generated automatically. The success page suggests the obvious next step, usually an SSL check for the same host. Check discovery — the screen that scans a server and proposes checks — was rebuilt to be easier to scan and configure.
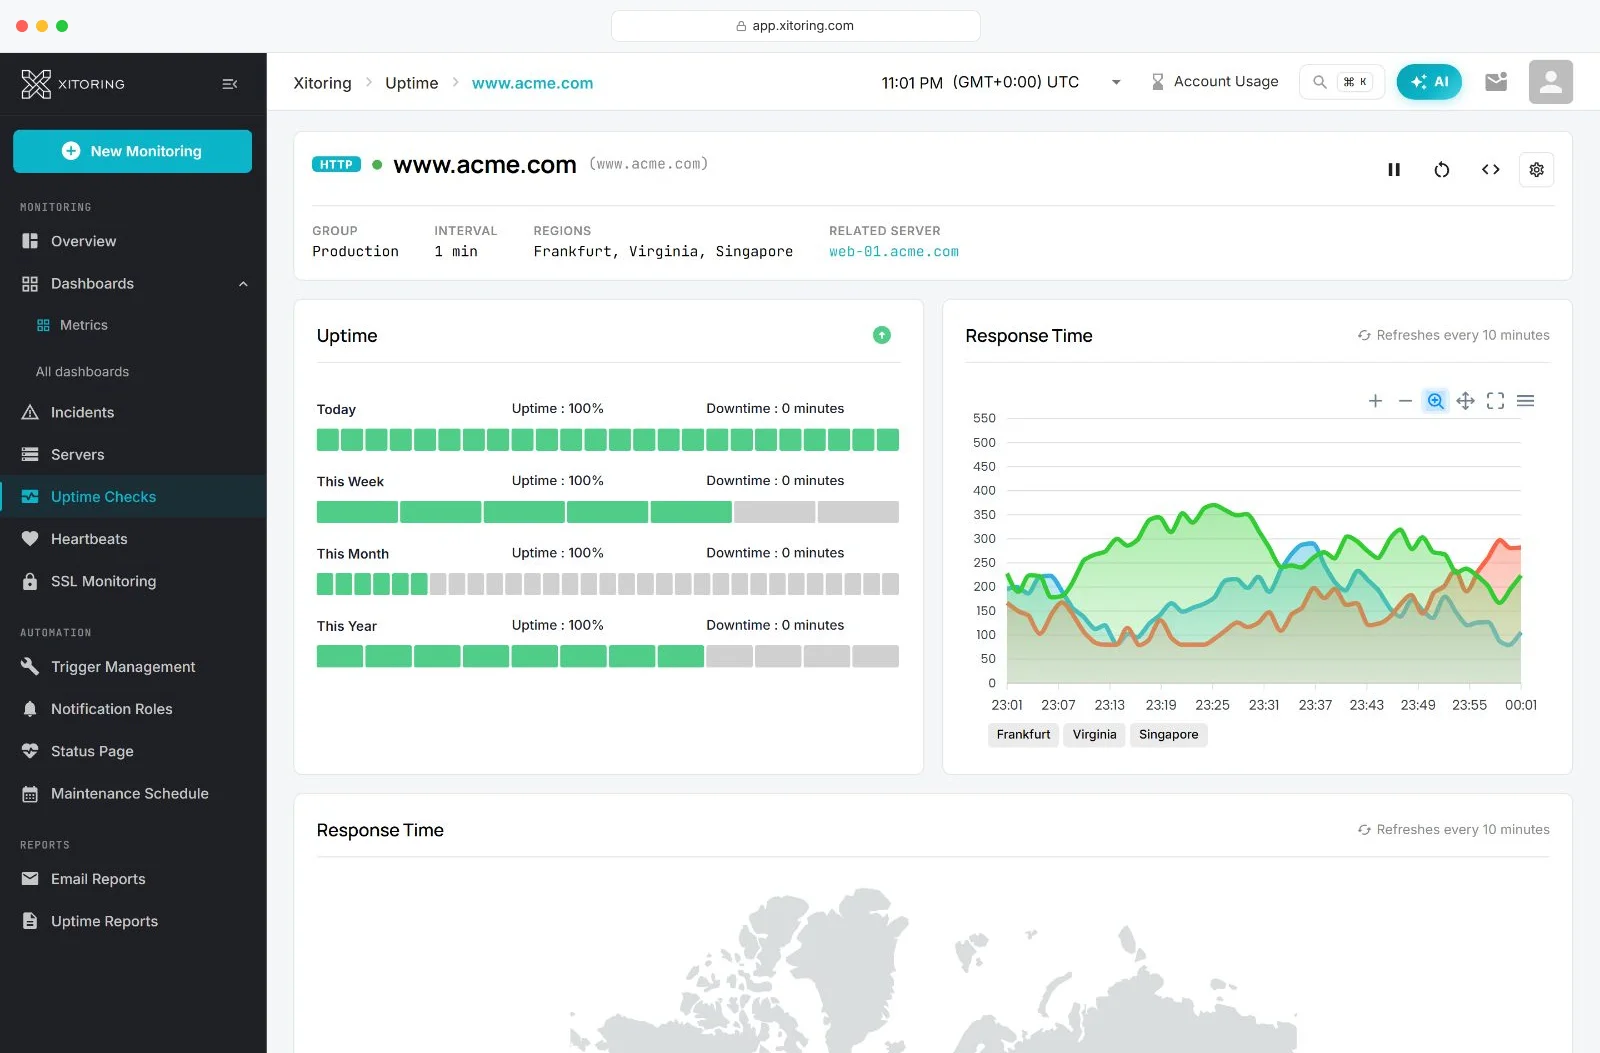
Each check's overview page shows average latency and latency from every monitoring location on one graph, a geo map for HTTP and ping checks, and any maintenance window that currently applies. Smart fault tolerance — confirming a failure from additional nodes before an incident opens — covers server monitoring as well as uptime checks, so there are fewer false pages.
Heartbeats and cron jobs
Heartbeat checks used to be a tab on the uptime page. In 3.0 they're fully separate: their own section in the sidebar, a redesigned list and detail view with check-in history, filters, status at a glance, and a code snippet for each check — curl, wget, a crontab line — so wiring up a cron job takes one copy-paste. Advanced heartbeats support grace periods and expected intervals, and Xitogent-based heartbeat monitors can be edited like any other.
Incidents
The incidents page is built around a heatmap — where and when incidents cluster — with a centralized incident feed below it. Date filtering is the primary way to slice history, and it now works the way you'd expect.
The incident detail page has a timeline: when it opened, which nodes confirmed it, which notification roles were alerted and how many times, and when it resolved. Root cause is attached automatically where we can determine it — for server incidents that includes the top five processes by CPU, memory and load at the time. Incident notes can be added and optionally published to your status page. Incidents can be resolved manually, and in bulk.
Two AI features live here: incident insights, a plain-language read of what likely happened and what to check first, and importance scoring, which ranks open incidents so on-call knows which one to open first when several fire at once.
SSL monitoring
The SSL monitoring page has sorting, filters and bulk actions, and each certificate's progress bar shows a readable "days remaining" label — with the right arithmetic for certificates that have already expired. The expiry widget on the dashboard uses the same numbers. Certificate insight and grading — chain, protocol, cipher, known weaknesses — shows on each check.
Status pages
Public status pages were rebuilt on both sides. On the editor side, a six-layout picker and color presets get a page looking like part of your brand without writing any CSS. Around that: rename, reorder and group checks, hide groups, custom CSS when you do want it, custom domain with CNAME help, translations, Google Tag support, and email subscribers with import and export.
On the public side: a header background image, current overall status shown at the top, optional uptime percentages and graphs per check, recent incidents with notes, and a customizable footer with social links. Embeddable status and uptime widgets are available for your own site. If you'd rather keep an existing Atlassian Statuspage, Status.io, Statuspal or Instatus page, Xitoring can feed incidents into those instead.
Maintenance schedules
The maintenance page and its schedule form were redesigned, recurring schedules work properly (including windows that span midnight), and any check or server covered by a window shows that on its own overview page — so nobody spends ten minutes debugging why a check is "paused."
Notifications
The notification role page — where you decide who gets alerted, on what channel, and how often — was redesigned with a categorized accordion layout, so you open the section you're changing instead of scrolling one long form. Roles can be marked as default, so new triggers pick the right one automatically. Slack and Microsoft Teams have proper app integrations (replacing the old webhook-style ones), WhatsApp supports multiple numbers, and the full list of notification channels still runs to email, SMS, phone call, push, webhook, Telegram, Discord, Mattermost, Google Chat, Opsgenie, PagerDuty, Splunk On-Call, Pushover, Pushbullet, Gotify, Ntfy, Spike.sh, AlertOps and Zapier.
Push notifications go to the redesigned mobile app for iOS and Android, which shares the new visual language with the web panel.
Graphs, metrics and custom dashboards
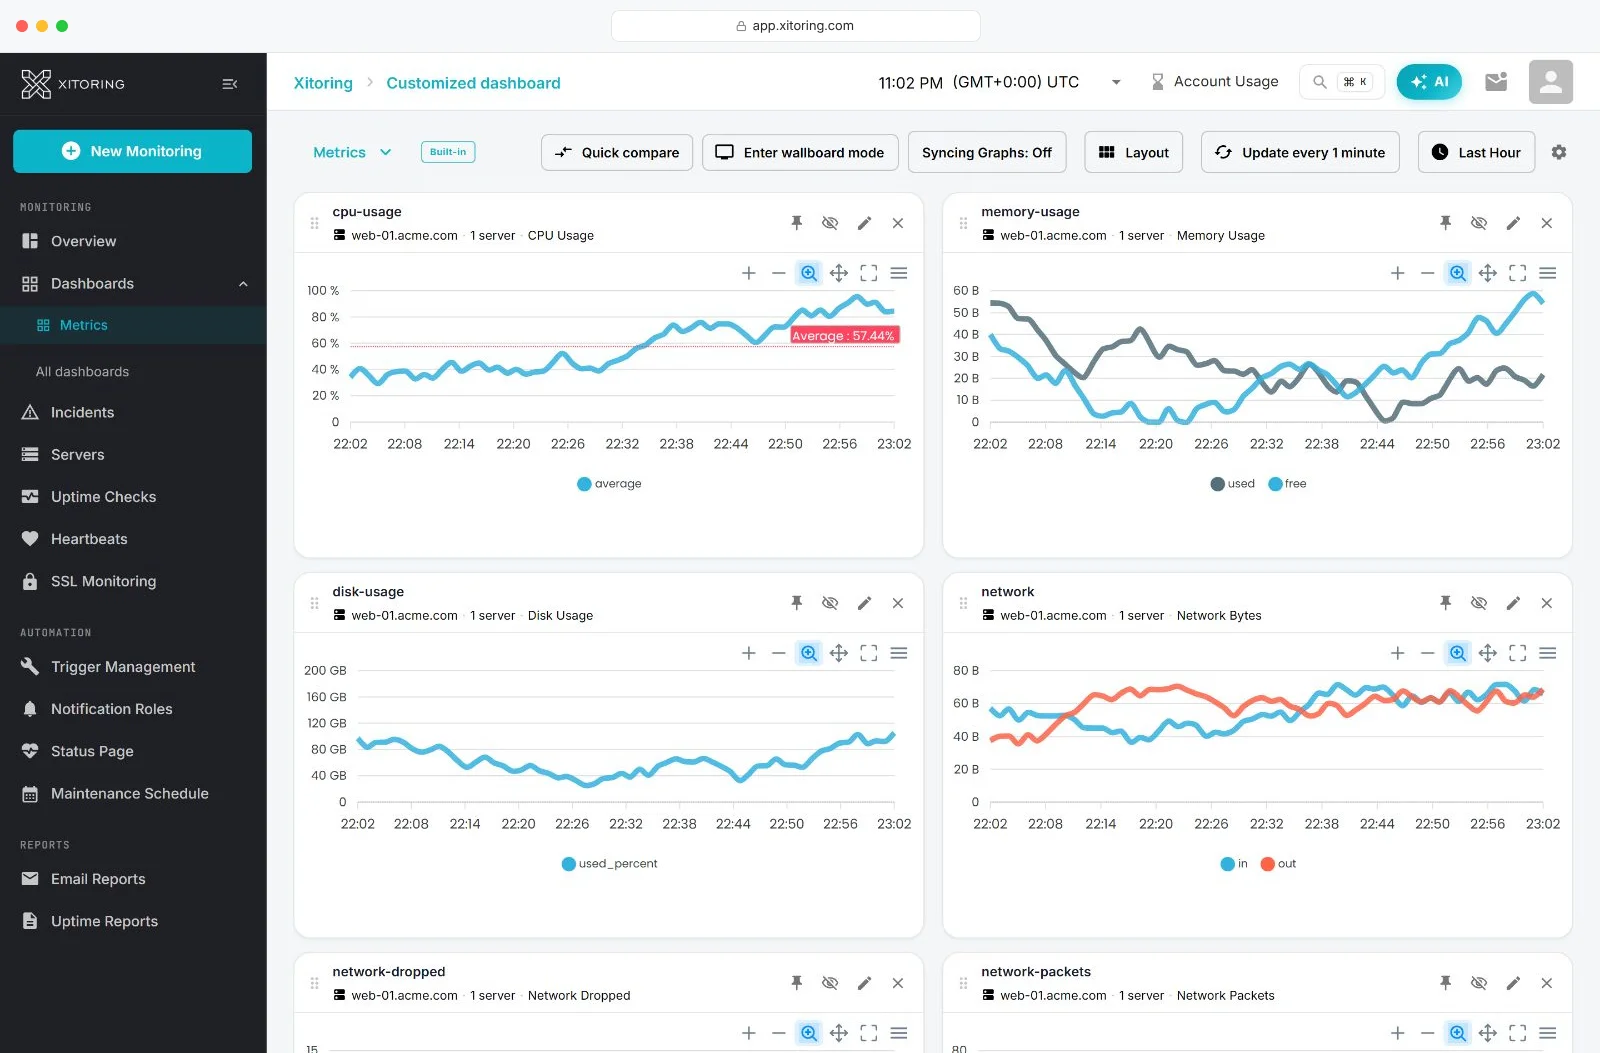
Every graph in the app was redrawn: cleaner axes, decimals only where they add information, bar and line types, custom periods, chart backgrounds that finally behave in dark mode, and an advanced date-time picker for precise ranges. The metrics page — where you explore any metric across any set of servers — got filters that persist in the URL, so a view is a link you can share.
Custom dashboards are finished in 3.0: widget templates to start from, sharing, a default-dashboard setting, quick compare, a wallboard mode, and the same drag-and-drop as the main dashboard.
Sign-in, account and the small stuff
Login, registration and forgot-password were redesigned, with a new reset-password flow, and new accounts go through a guided onboarding flow right after they register. Account settings, billing, the profile page, tickets, sub-accounts, contacts, password and two-factor management were all redesigned too, and so were the error pages. Global search was rebuilt and is faster, and keyboard shortcuts now work throughout the app. The timezone selector — long a sore point — was rewritten and now appears on uptime embed codes, email reports and uptime reports (the email report form was redesigned as well), so the numbers you send out are in the timezone you meant. Accessibility was improved across the board. Single sign-on is available for enterprise accounts, alongside Google, GitHub, Microsoft and DigitalOcean login.
Anomaly detection
Everything above is a better place to look at your data. 3.0 also adds something that looks at it for you.
AI/ML anomaly detection scores your servers automatically and produces a plain-language health summary for each, so drift that hasn't tripped a trigger yet shows up before it turns into an incident. It runs on the AIOps machine-learning layer that has been maturing under the panel — per-host, per-metric baselines, anomaly scoring, capacity forecasts with a date attached, and root cause analysis — and it runs alongside your triggers rather than replacing them.
The AI assistant
Release 2.40 added a way to ask. 3.0 rebuilt it.
The in-panel AI assistant sits next to whatever page you're on and already knows what it is. Open a server and ask about the memory trend, and the answer references that server, those timestamps and the incidents that overlap. Ask which of the database servers are running hottest this week, and why and you get a ranked list with the likely driver for each, drawn from your account's real metrics, not from a generic model's idea of what a database server does.
In 3.0 the chat itself was reimagined: structured questions, answers rendered as rich blocks rather than walls of text, and inline references back to the data each answer draws on. Conversations are kept in a chat history sidebar, where you can rename or delete any thread. It also handles the unglamorous cases better — an empty, stalled or session-expired response now fails cleanly instead of leaving you watching a spinner.
Because it sits on the same ML layer as anomaly detection, it explains rather than just reports. The assistant never raises an incident on its own; your triggers and anomaly alerts do that. Conversations stay inside your tenant and aren't used for training.
The MCP server
The assistant is for when you're in Xitoring. The MCP server is for when you aren't.
Point Claude Code, Claude Desktop, Cursor, VS Code or any MCP-compatible client at one hosted endpoint with your API key:
claude mcp add --transport http --scope user xitoring \
  https://app.xitoring.com/mcp \
  --header "Authorization: Bearer YOUR_API_KEY"
The client discovers 70 tools and 8 resources on its own. Of those, 52 are read-only — metrics, checks, incidents, reports, ML insight. The 18 write actions — resolve an incident, pause a check, create checks, schedule maintenance, manage triggers — are grouped separately so you can see exactly what's mutable, and most clients ask for approval before running one. Deleting the API key revokes everything instantly. It's included on every plan, and it's in beta: the endpoint and auth are stable, individual tool shapes may still change.
New to the protocol? What Is the Model Context Protocol (MCP)? is the plain-language version.
Frequently asked questions
Do I need to do anything to get Xitoring 3.0?
No. 3.0 is the app. Log in and it's there, on every plan.
How is 3.0 different from the 2.37–2.40 updates?
Those releases redesigned the panel a page at a time and, in 2.40, introduced the AI assistant and the MCP server. 3.0 rebuilt every page and component on a single design system and added what they didn't have: anomaly detection, a reimagined assistant with chat history, the six-layout status page picker, redesigned billing, profile and contacts pages, and a new sign-up and onboarding flow.
Did anything get removed?
The region selector on the add-server form (now automatic) and the bar chart type in one graph view that had a performance problem. The sidebar was simplified, so a few pages live in different places, but everything else was moved or redesigned, not removed.
Is the mobile app updated too?
Yes. The iOS and Android apps share the new visual language and receive the same push notifications.
Does the AI assistant see my real data?
Yes — it's wired into your account's metrics, hosts, alerts and incident history, and answers reference real timestamps. Your data isn't used to train models.
Can an AI agent change my monitoring setup through MCP?
Only through the 18 clearly listed write tools, and only with a key you issued. The other 52 tools can't change anything.
Where's the full changelog?
In the release notes, release by release, with 3.0 at the top.
What's next
This is the first of two posts on the new Xitoring. The second goes deeper on specific workflows with their own videos — on-call from the mobile app, building custom dashboards, and wiring an AI agent into a real incident.
If you haven't logged in for a while, the walkthrough above is the fastest way to catch up. If you haven't tried Xitoring at all, start monitoring free — no credit card required.