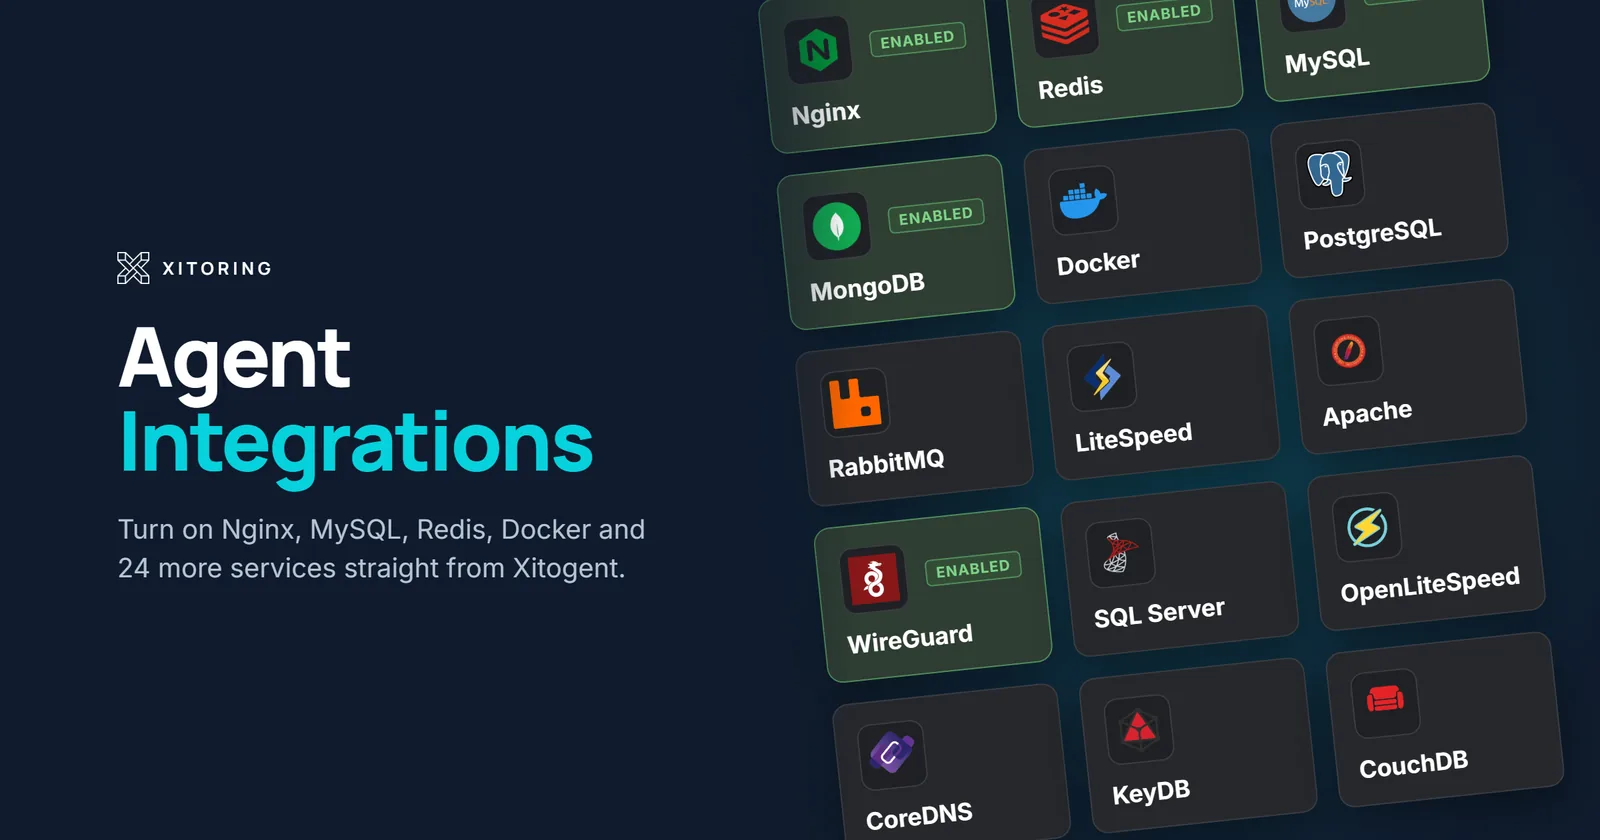
Server monitoring integrations are where Xitoring goes past CPU, memory and disk. They're how you see MySQL slow queries, Nginx requests per second, Redis evictions, RabbitMQ queue depth and per-container Docker usage — the metrics that tell you which part of the server is in trouble, not just that something is.
For a long time, turning one on meant opening a terminal: SSH into the server, run sudo xitogent integrate, pick the service from a numbered list, answer the prompts, and let the CLI write a config file. Changing it later meant going back to the server. Across a fleet, that's a lot of SSH sessions for what is really a form.
So now it's a form. Every integration Xitogent supports — 28 of them, from Nginx and MySQL to WireGuard and CoreDNS — can be enabled, edited and disabled from the Xitoring panel. Click Enable Integration, fill in the connection details, click Save. No commands, no config files.
Server Monitoring Integrations in 2 Clicks, No Commands
How to enable an integration in 2 clicks
Everything lives on the server itself. If Xitogent is already running there, there's nothing new to install.
- Go to Servers → [your server] → Integrations.
- Click Enable Integration and choose the service from the list.
- Fill in what Xitogent needs to reach it. For most integrations that's a host and port — usually
127.0.0.1and the service's default port — plus credentials where the service requires them. - Click Save.
Metrics usually start arriving within five to ten minutes, and the integration shows as Enabled on the server's Integrations tab.
Two examples of what the form actually asks for:
- Apache — the address where
mod_statusserves its statistics, typicallyhttp://127.0.0.1/server-status. That's the whole form. - MySQL — host, port, and the username and password of the monitoring user you created for Xitogent. Save, and connections, queries per second, slow queries and replication metrics start filling in.
Or let Auto-Discovery find it for you
You often don't need to go looking at all. About ten minutes after Xitogent is installed, Auto-Discovery scans the server for running services and lists them as recommendations in the server view, each with an Enable Integration button next to it. Click it, confirm the connection details, and you're done.
On a fresh server, that turns "install the agent, then figure out what to monitor" into "install the agent, then accept the suggestions."
Command line vs. the panel
With xitogent integrate |
In the Xitoring panel | |
|---|---|---|
| Enable | SSH in, run the wizard, answer the prompts | Enable Integration, fill in the fields, Save |
| Edit | SSH in and edit the config file, or re-run the wizard | Open the integration, change the field, save |
| Disable | SSH in and remove the integration on the server | One click in the panel |
| Who can do it | Someone with root on the box | Anyone who manages the server in Xitoring |
| Rolling out to 10 servers | 10 SSH sessions | 10 forms in one browser tab |
The CLI still works, and if you provision servers with Ansible, Terraform or a golden image, scripting xitogent integrate remains the right call. The panel is for everyone else, and for every change after day one.
Edit and disable without going back to the server
Services change. MySQL moves to port 3307, the monitoring user's password gets rotated, a reverse-proxy change moves Apache's status page to a different path. Before, every one of those meant finding the config file on the server and editing it by hand — and hoping you didn't introduce a typo that silently stopped a graph from updating.
Now you open the integration in the panel, change the field and save. The same goes for turning things off: decommissioning a service, moving a database to another host, or trimming what you watch on a dev box is one click, and Xitogent stops collecting that integration's metrics. You can enable it again from the same place at any time.
All 28 integrations you can turn on from the panel
Every integration follows the same enable, edit and disable flow:
- Databases: MySQL, PostgreSQL, SQL Server, MongoDB, CouchDB, InfluxDB
- Caches and key-value stores: Redis, KeyDB
- Web servers: Nginx, Apache, IIS, LiteSpeed, OpenLiteSpeed
- Proxies, load balancers and runtimes: HAProxy, Varnish, PHP-FPM
- Queues and streaming: RabbitMQ, Kafka
- Containers and processes: Docker, Supervisor
- Mail: Postfix, Dovecot, Exim
- VPN and DNS: OpenVPN, WireGuard, CoreDNS
- System: Netstat, Disk Health
Each link goes to what that integration measures. The full overview is on the integrations page; how many integrations you can run per server depends on your plan.
What still happens on the service side
The panel replaces every Xitogent command. It can't change how your services expose their statistics, and a few of them need to be told to do that once:
- Apache needs
mod_statusenabled. - HAProxy needs its stats page turned on.
- MySQL needs a monitoring user with the right privileges. Use a dedicated read-only user rather than giving Xitogent root.
- Docker, Supervisor, Netstat and Disk Health need nothing at all.
Each integration's documentation page covers its one-time preparation. After that, enabling, tuning and turning it off all happen in the panel.
How this compares to other monitoring tools
Most agent-based tools still treat integrations as files on the host. In Datadog you enable an integration by editing its conf.yaml under the agent's conf.d directory and restarting the agent. Netdata auto-detects many services, but configuring a collector from its UI requires a paid Netdata Cloud plan; otherwise you're editing YAML on the node.
Datadog's catalog is far larger than Xitoring's, and if you need a thousand integrations, that matters more than how you switch them on. If the services you run are on the list above, the panel gets you from "we should be watching Redis" to a working Redis dashboard without anyone opening a shell.
Why it matters
- The person managing monitoring doesn't need a shell. On a lot of teams, the people who set up alerting aren't the people with root on every host. Now they don't have to be.
- Fewer typos, fewer mystery gaps. A form validates what you enter. A hand-edited config file doesn't, and a mistake there usually shows up as a graph that quietly stopped updating.
- Fleets get faster. Rolling an integration out to ten web servers is ten short forms, not ten SSH sessions.
- Everything is visible in one place. Which integrations are on, on which servers — you see it where you already look at the metrics.
Frequently asked questions
Do I need to install anything new to enable integrations from the panel?
No. If Xitogent is running on the server, the Integrations tab is ready to use.
Which server monitoring integrations can I enable without commands?
All 28 that Xitogent supports: MySQL, PostgreSQL, SQL Server, MongoDB, CouchDB, InfluxDB, Redis, KeyDB, Nginx, Apache, IIS, LiteSpeed, OpenLiteSpeed, HAProxy, Varnish, PHP-FPM, RabbitMQ, Kafka, Docker, Supervisor, Postfix, Dovecot, Exim, OpenVPN, WireGuard, CoreDNS, Netstat and Disk Health.
Do I still need to SSH into the server at all?
Not for Xitogent. Some services need a one-time change to expose their statistics — enabling Apache's mod_status, or creating a MySQL monitoring user — and that happens on the service, as it always has.
How long until metrics show up?
Usually five to ten minutes after you save the integration.
Does the xitogent integrate command still work?
Yes. The CLI and the panel configure the same integrations, so use whichever fits. Scripted provisioning usually favors the CLI; day-to-day changes are faster in the panel.
What does disabling an integration do?
Xitogent stops collecting that integration's metrics on that server. You can enable it again from the same place at any time.
Try it
If you already monitor servers with Xitoring, open any server, go to the Integrations tab and start with the database you worry about most. If you're new, install Xitogent, let Auto-Discovery find what's running, and enable your first integration without touching the command line.
Start monitoring free — no credit card required.