Elasticsearch Monitoring
Monitor Elasticsearch cluster status (green/yellow/red), unassigned shards, JVM heap usage, GC pauses, indexing/search rate, thread pool rejections, and ILM tier health in real time — via the native `_cluster/health` and `_nodes/stats` APIs.
Why monitor Elasticsearch?
Elasticsearch powers application logs (ELK), full-text and vector search, and modern observability pipelines. When the cluster degrades (yellow or red), shards go unassigned, or JVM heap pressure spikes, search outages and ingest losses follow within minutes. Monitoring catches cluster health drift before pod restarts cascade across the fleet.
Elasticsearch monitoring, explained
Elasticsearch monitoring catches cluster degradation (yellow / red status), unassigned shards, JVM heap pressure, GC pause spikes, and thread pool rejections before they cause search outages, ingest failures, or data loss. For ELK log pipelines, vector-search workloads, and any production cluster, per-node visibility is what separates a 30-second auto-recovery from a cluster-wide outage. Xitoring auto-discovers your Elasticsearch, queries the native APIs with a cluster:monitor user, and routes alerts to Slack, PagerDuty, Telegram, or your existing on-call.
What we monitor
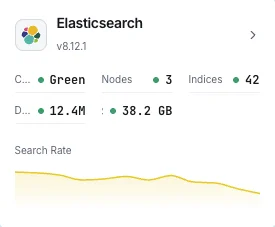
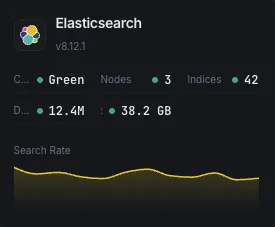
Cluster Health
Overall cluster status (green/yellow/red) and active shard count.
JVM Heap Usage
Heap used, committed, and max across all nodes with GC stats.
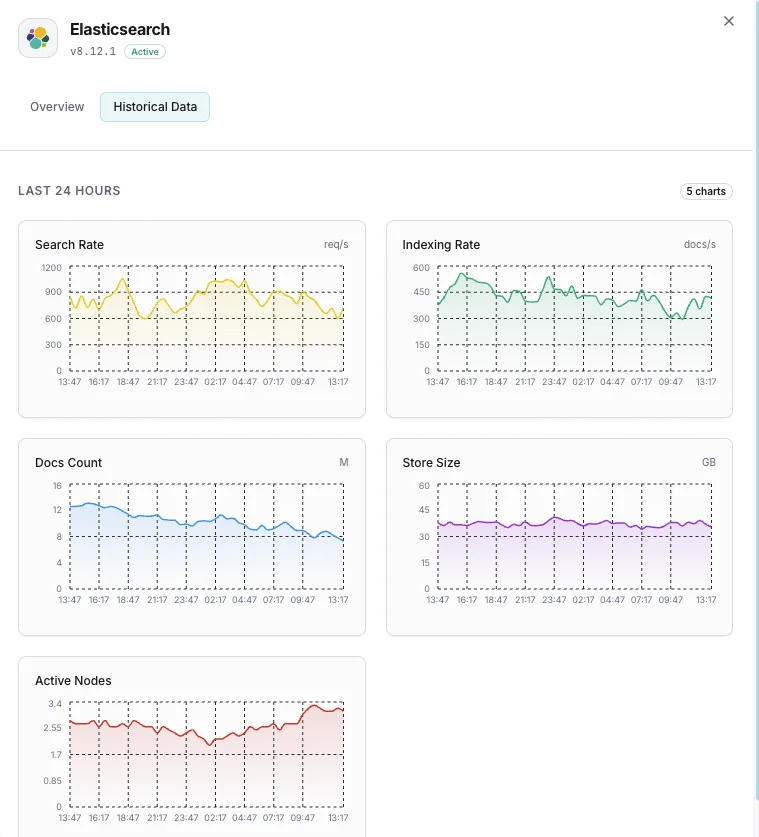
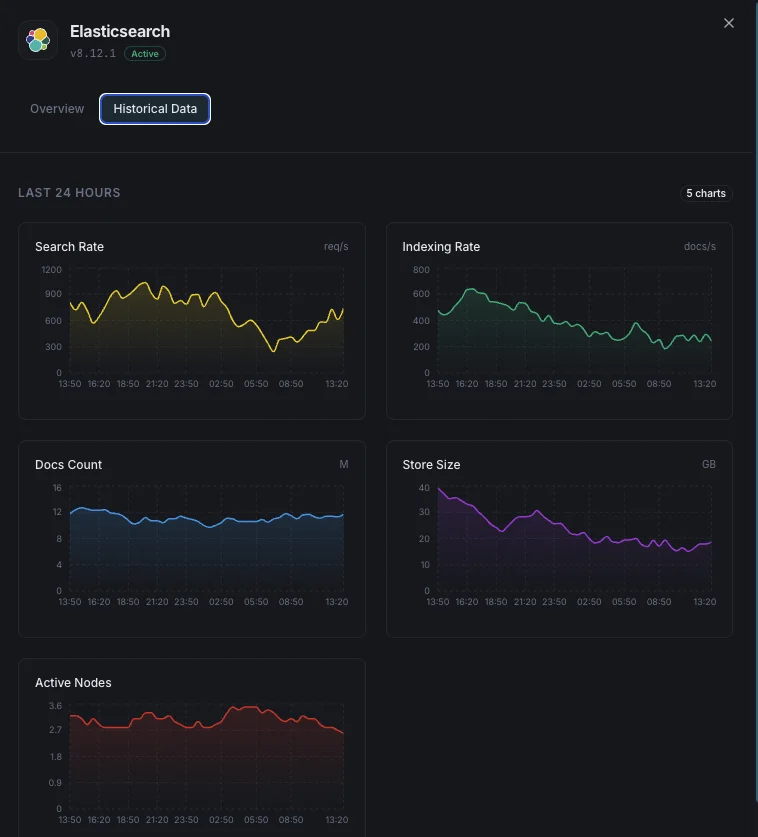
Indexing Rate
Documents indexed per second across the cluster.
Search Rate
Search queries per second and average search latency.
Shard Count
Active, relocating, initializing, and unassigned shards.
Pending Tasks
Cluster-level pending tasks that can indicate bottlenecks.
CPU Usage
Per-node CPU utilization and OS-level load averages.
Disk Usage
Storage used per node and available disk space.
Thread Pool
Active, queued, and rejected tasks in each thread pool.
Circuit Breakers
Memory estimates and trip counts for request/fielddata/in-flight breakers.
Segment Count
Number of Lucene segments and merge activity.
Fielddata Cache
Fielddata cache size and eviction count.
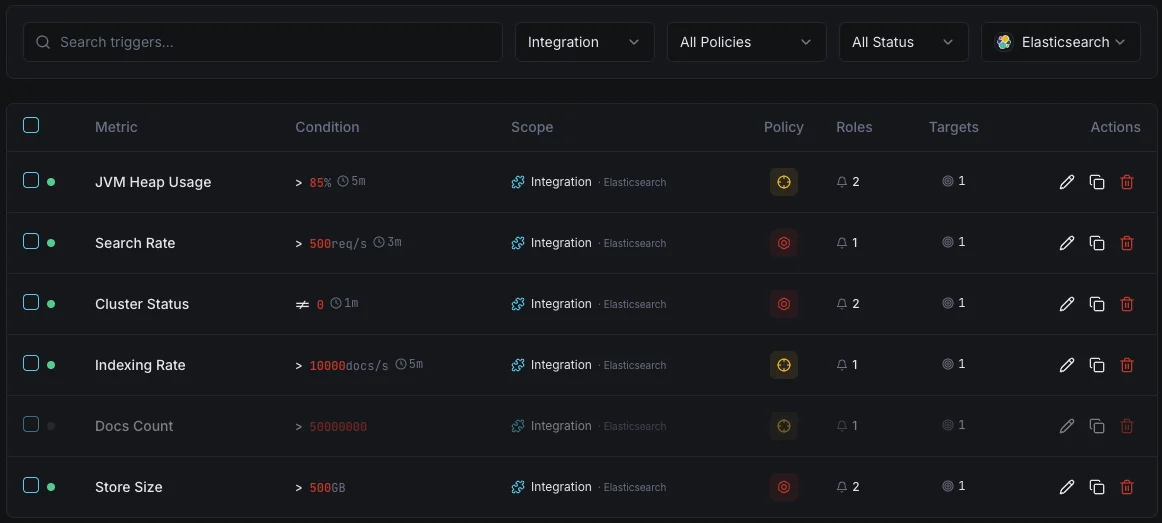
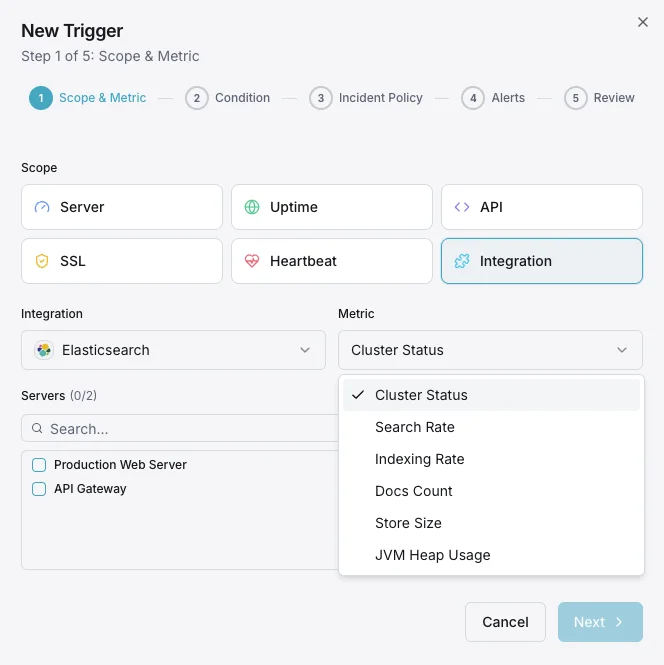
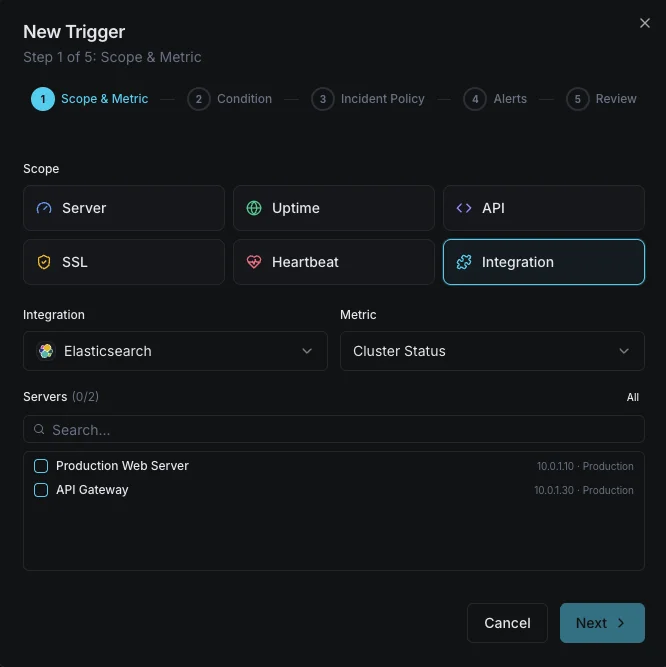
Configurable alert triggers
Set up custom triggers in your dashboard to get notified the moment Elasticsearch metrics cross your defined thresholds.
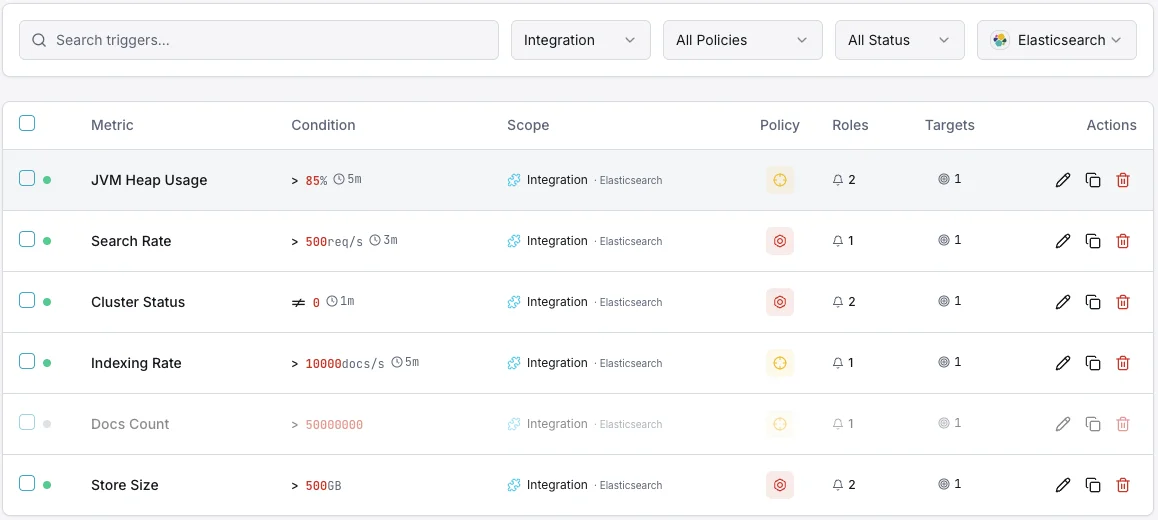
Cluster Health
criticalFires when cluster status degrades to yellow or red, indicating shard allocation issues.
JVM Heap Usage
criticalTriggers when JVM heap usage exceeds threshold, risking out-of-memory errors and node instability.
Indexing Rate
warningAlerts when indexing throughput drops below baseline, indicating ingestion pipeline issues.
Search Latency
warningFires when average search latency exceeds threshold, degrading user-facing search quality.
Unassigned Shards
criticalTriggers when shards remain unassigned, leaving data under-replicated and at risk.
Thread Pool Rejections
warningAlerts when thread pool queues overflow and start rejecting requests.
Importance of Elasticsearch Monitoring
Elasticsearch underpins search functionality, log aggregation, and real-time analytics. Without monitoring, cluster degradation, JVM pressure, and unassigned shards can cascade into search outages and data loss.
- Detect cluster health degradation before it impacts search availability
- Monitor JVM heap to prevent out-of-memory crashes
- Track indexing throughput to ensure data ingestion pipelines stay healthy
- Identify unassigned shards that leave data under-replicated
- Optimize search latency for user-facing applications
Why Choose Xitoring
Xitoring delivers enterprise-grade Elasticsearch monitoring with zero-config setup. Our lightweight agent auto-discovers your Elasticsearch nodes, starts collecting metrics in under 60 seconds, and integrates with your existing notification channels.
- One-command install — no complex YAML or config files
- 15+ global monitoring nodes for low-latency checks
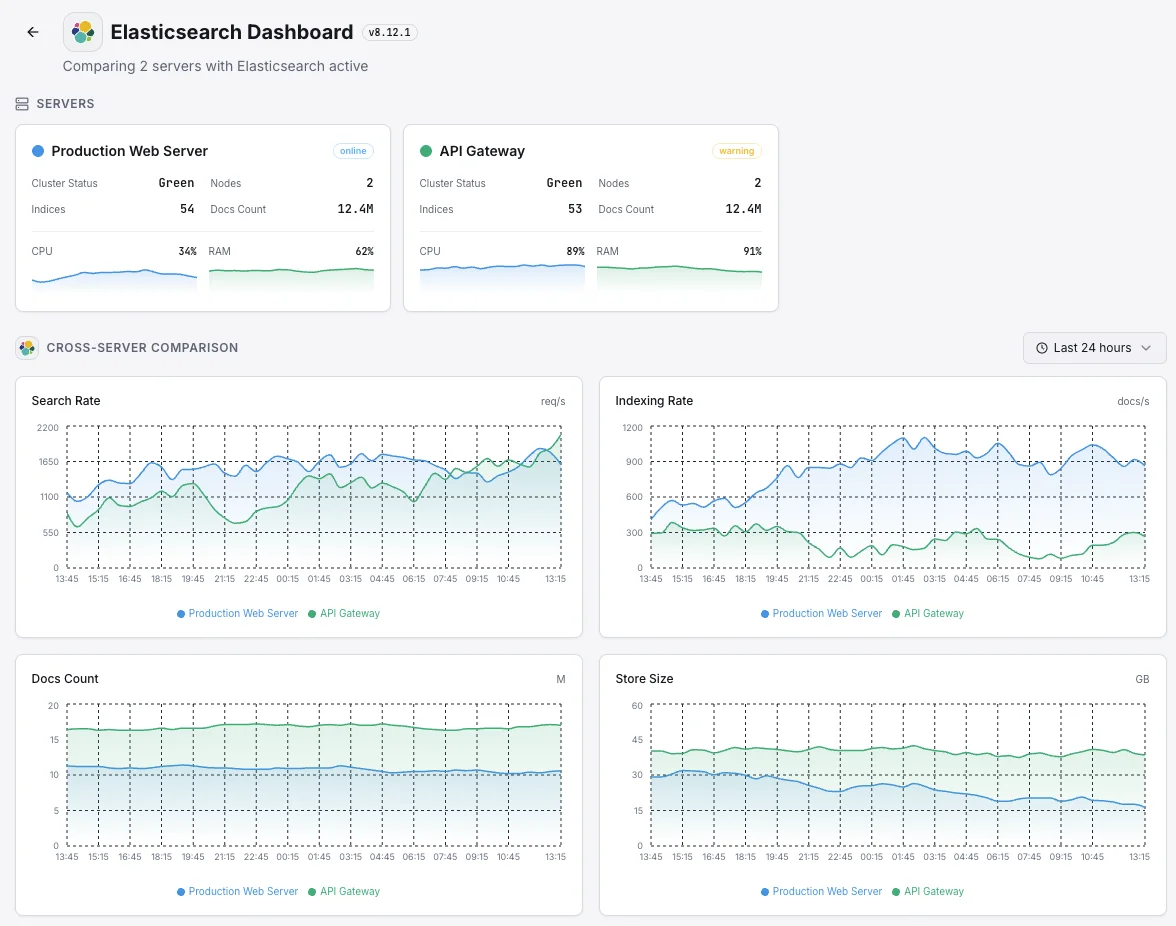
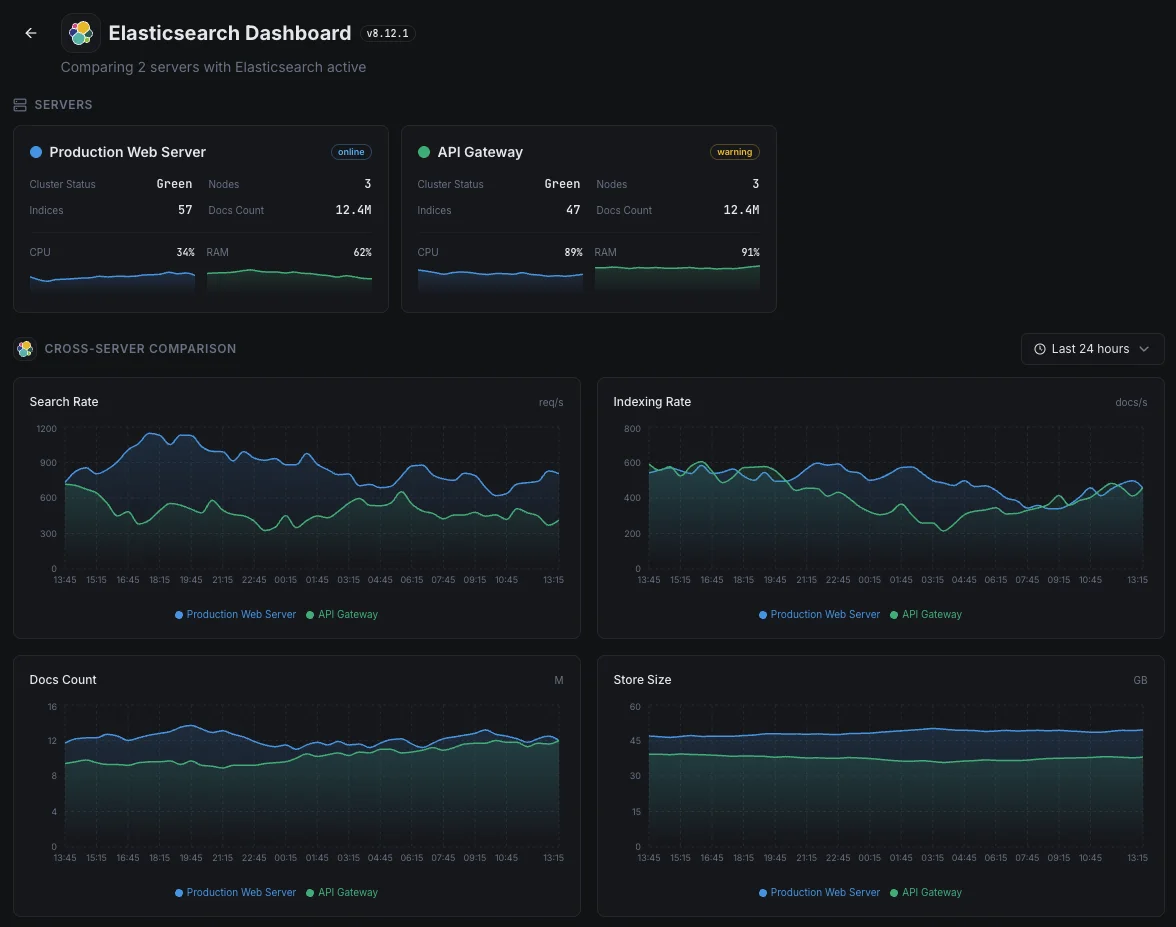
- Unified dashboard for servers, search clusters, and uptime
- Flexible alerting via Slack, PagerDuty, Telegram & more
- Historical data retention for capacity planning & audits
Common Elasticsearch monitoring scenarios
Where Elasticsearch typically runs today — and what could go wrong if no one's watching.
Logs and observability data
When apps and servers stream their logs into Elasticsearch, any backlog or rejection means parts of the picture are missing — exactly when an incident makes them most needed. We catch the bottleneck while it's small, so the team's diagnostic history stays complete.
Search for websites, apps, and AI features
When search powers a website, an app, or an AI feature, a slow query directly hurts user experience and conversions. We watch response times and capacity so a search slowdown can be fixed before it becomes a revenue or product problem.
Managed search on AWS or another cloud
Cloud providers run the service for you, but they don't tell you when your own workload is overwhelming it or your queries are starting to slow down. We close that visibility gap so cost and performance both stay in your control.
Prerequisites for Elasticsearch
Make sure you've got these in place — most installs are a 60-second job once they are.
- Elasticsearch 7.x, 8.x, or 9.x — OR OpenSearch 1.x / 2.x — reachable on the REST port (default 9200)
- A monitoring user with
cluster:monitorprivileges if security is enabled (ormonitor_clusterrole on Elastic Stack 8+) - TLS/CA configuration available to Xitogent if HTTPS is required
Get started in minutes
Install Xitogent on your server
If you haven't already, install the lightweight Xitogent monitoring agent on your server.
curl -s https://xitoring.com/install.sh | sudo bash -s -- --key=YOUR_API_KEYVerify Elasticsearch API is accessible
Xitogent uses the Elasticsearch REST API to collect metrics. Verify the cluster is reachable:
curl -s http://localhost:9200/_cluster/health | python3 -m json.toolEnable the Elasticsearch integration
Use the Xitoring dashboard or CLI to enable the Elasticsearch integration.
sudo xitogent integrateConfigure alert thresholds (optional)
Set custom thresholds for cluster health, JVM heap, or indexing rate to get notified when something needs attention.
Verify it's working
Run this command on the server to confirm Xitogent picked up the integration. Fresh metrics will start streaming to your dashboard within ~30 seconds.
sudo xitogent statusConsidering alternatives?
See how Xitoring stacks up against the alternatives for Elasticsearch monitoring — flat pricing, deeper integrations, and one agent that covers your whole stack.


Frequently asked questions
What is Elasticsearch monitoring?
How do I monitor Elasticsearch cluster health?
What does yellow cluster status mean and how do I fix unassigned shards?
How do I monitor JVM heap usage and GC pauses?
How do I detect slow Elasticsearch queries?
How do I monitor Elasticsearch indexing rate and refresh latency?
What is a search thread pool and how do I monitor rejections?
Elasticsearch vs OpenSearch monitoring — what's different?
What Elasticsearch versions are supported?
Start monitoring Elasticsearch today
Set up in under 60 seconds. No credit card required. Full metrics from day one.
Start Free TrialKeep exploring