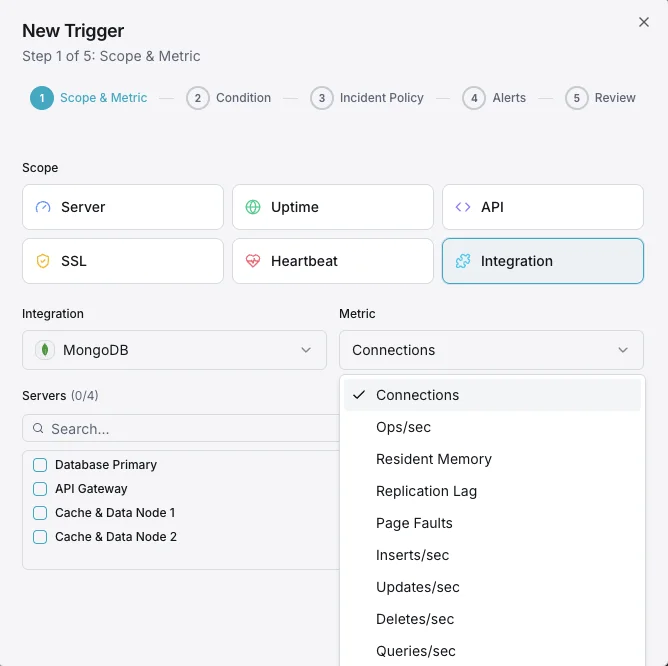
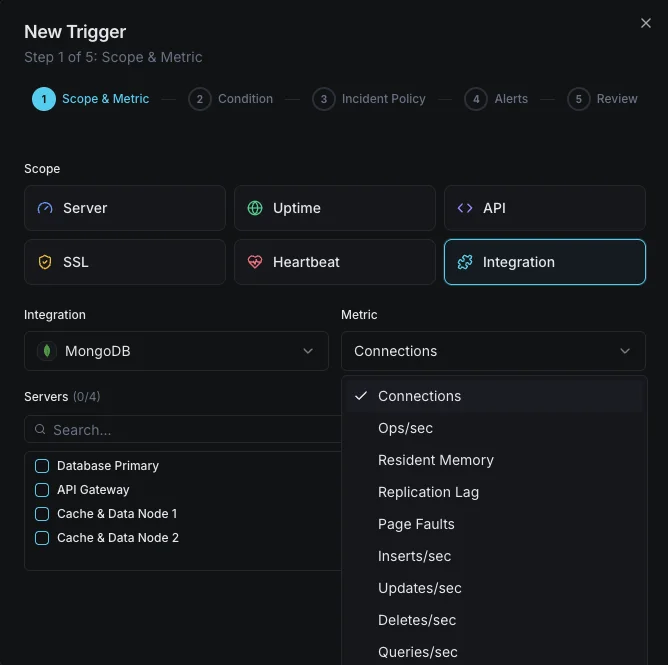
MongoDB Monitoring
Monitor MongoDB opcounters, WiredTiger cache fill / eviction, oplog window, replica-set lag, sharded balancer state, and slow queries in real time — via `db.serverStatus()` and `rs.status()`.
Why monitor MongoDB?
MongoDB stores documents for Node.js apps, MEAN/MERN stacks, and modern SaaS. Replication lag, oplog window collapse, and WiredTiger cache pressure show up as 'sometimes slow' before they become full outages. Monitoring catches the underlying signals before clients fall back, elections trigger, or data goes silently stale.
MongoDB monitoring, explained
MongoDB monitoring catches replication lag, oplog-window collapse, WiredTiger cache pressure, and runaway queries before they cause replica failures, secondary fallback storms, or user-visible slowdowns. For MEAN/MERN stacks, sharded clusters, and any replica-set deployment, per-node visibility is what separates a graceful failover from a multi-hour incident. Xitoring auto-discovers your MongoDB, queries the native server-status commands with the clusterMonitor role, and routes alerts to Slack, PagerDuty, Telegram, or your existing on-call.
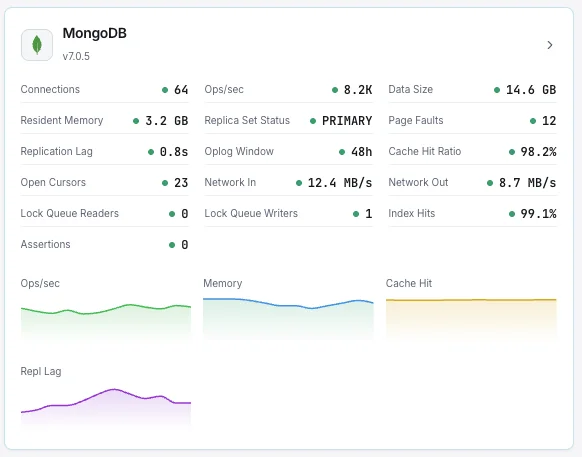
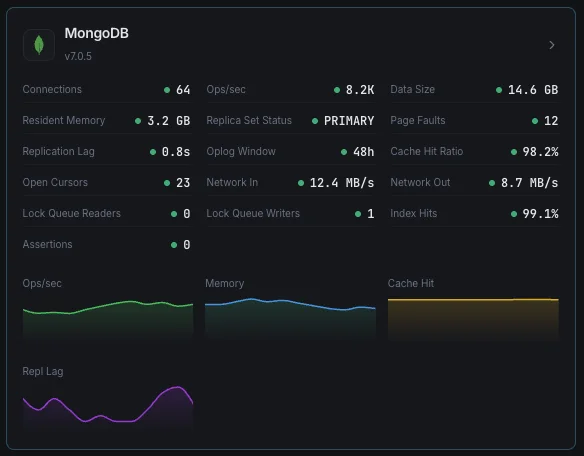
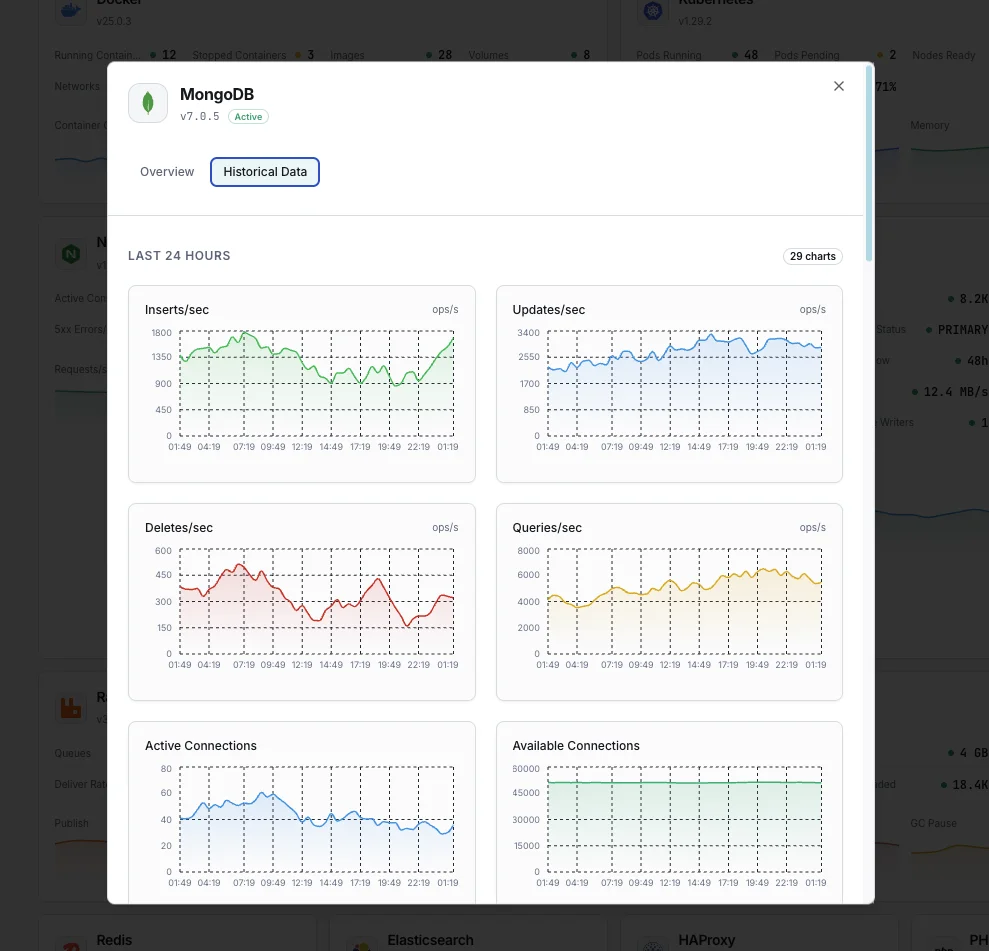
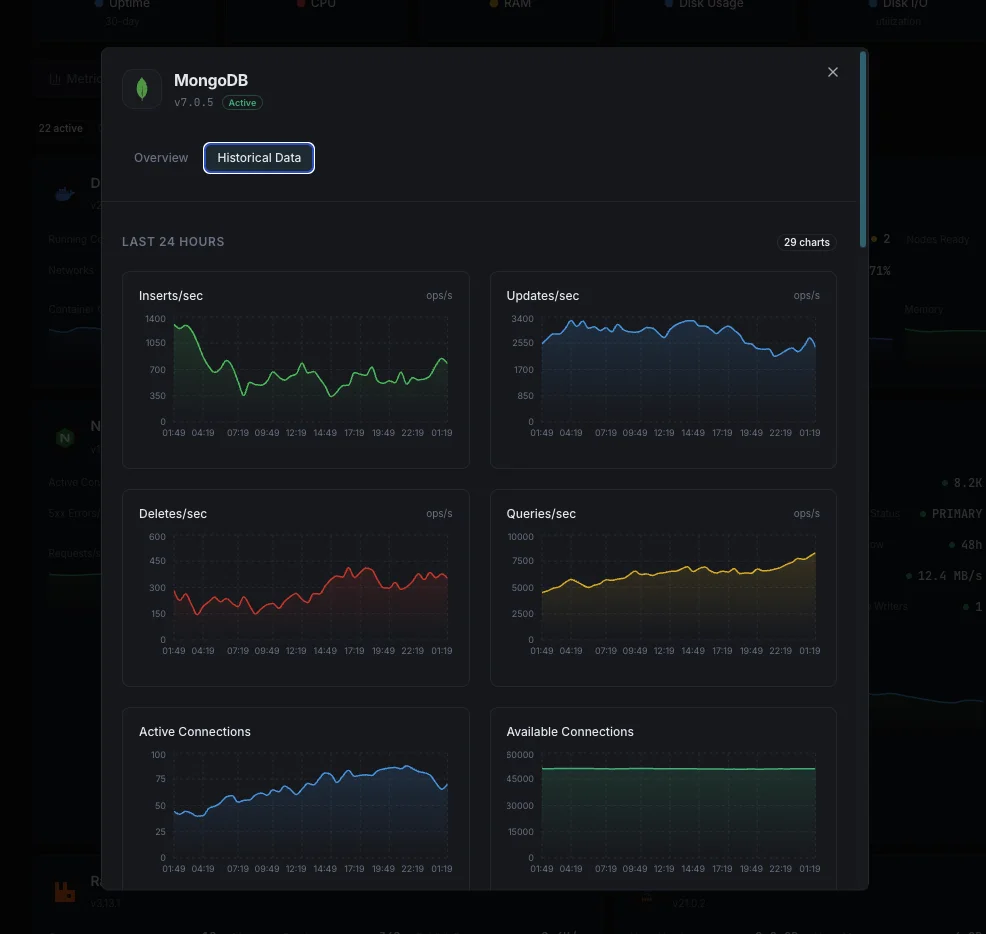
What we monitor
Document Operations
Rate of insert, update, delete, and query operations per second.
Connections
Current active, available, and total connections to the MongoDB instance.
Replication Lag
Time delay between primary and secondary replica set members.
Oplog Window
Duration of operations retained in the oplog for replication.
WiredTiger Cache
Bytes currently in cache, dirty bytes, and cache hit ratio.
Page Faults
Number of page faults indicating data not in memory.
Cursors
Number of open cursors including those with no timeout.
Network I/O
Bytes in/out and number of requests to the MongoDB instance.
Lock Queue
Number of operations waiting to acquire read or write locks.
Index Counters
Index access, hits, and misses indicating index effectiveness.
Storage Size
Total data size, index size, and free space on disk.
Assertions
Count of assert messages including regular, warning, and rollover.
Configurable alert triggers
Set up custom triggers in your dashboard to get notified the moment MongoDB metrics cross your defined thresholds.
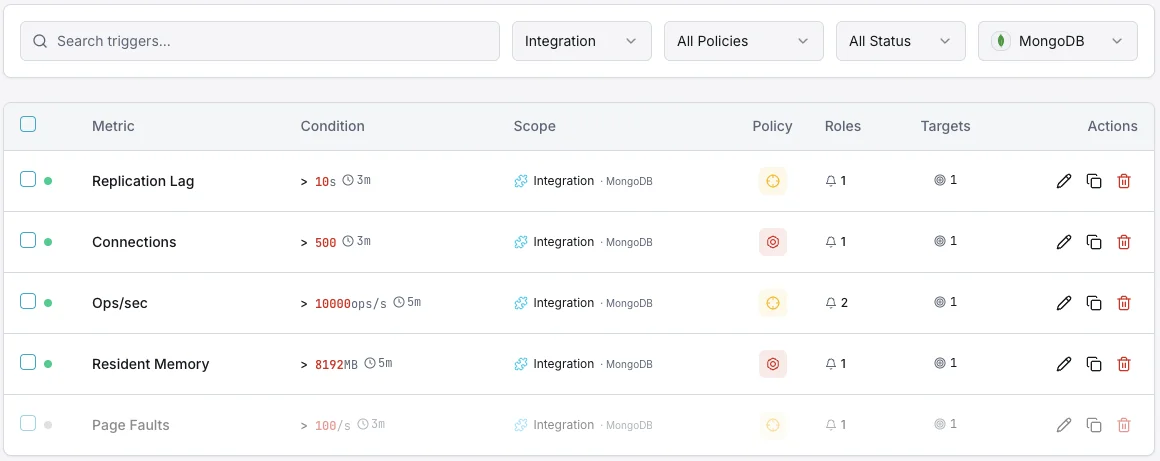
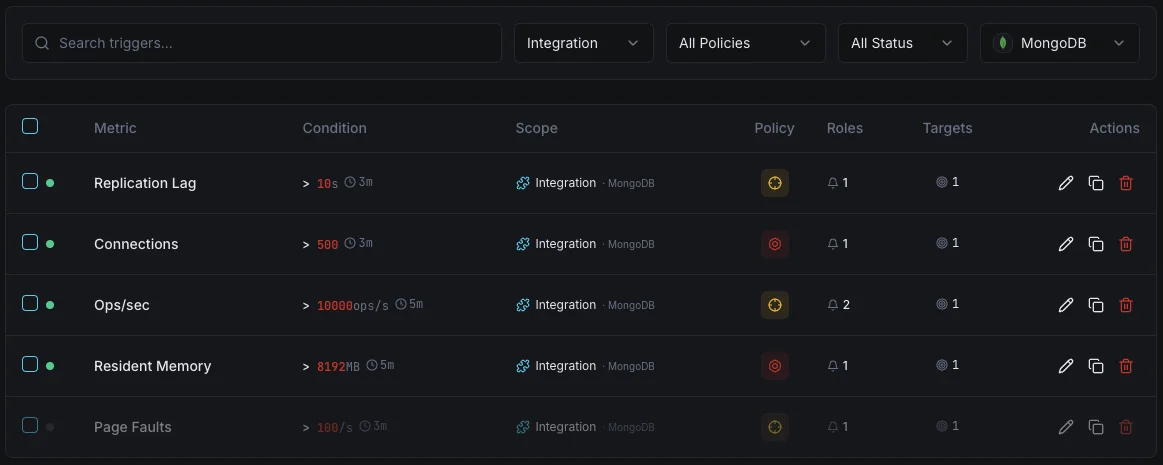
Replication Lag
criticalFires when secondary members fall behind the primary, risking data inconsistency during failover.
Connection Count
warningTriggers when active connections approach the maximum, indicating potential connection pool exhaustion.
WiredTiger Cache Usage
warningAlerts when cache utilization exceeds threshold, leading to increased disk I/O and slower queries.
Page Faults
criticalFires when page fault rate spikes, indicating working set exceeds available memory.
Lock Queue Length
warningTriggers when operations queue for locks, indicating contention and potential performance degradation.
Storage Space
criticalAlerts when disk space usage exceeds threshold, risking database writes being blocked.
Importance of MongoDB Monitoring
MongoDB powers mission-critical applications handling millions of documents. Without monitoring, replication drift, connection exhaustion, and cache pressure can silently degrade performance and lead to data loss.
- Detect replication lag before failover causes data inconsistency
- Monitor document operation rates to identify performance bottlenecks
- Track WiredTiger cache efficiency to optimize memory allocation
- Identify connection pool exhaustion from application clients
- Ensure storage capacity for uninterrupted database operations
Why Choose Xitoring
Xitoring delivers enterprise-grade MongoDB monitoring with zero-config setup. Our lightweight agent auto-discovers your MongoDB instances, starts collecting metrics in under 60 seconds, and integrates with your existing notification channels.
- One-command install — no complex YAML or config files
- 15+ global monitoring nodes for low-latency checks
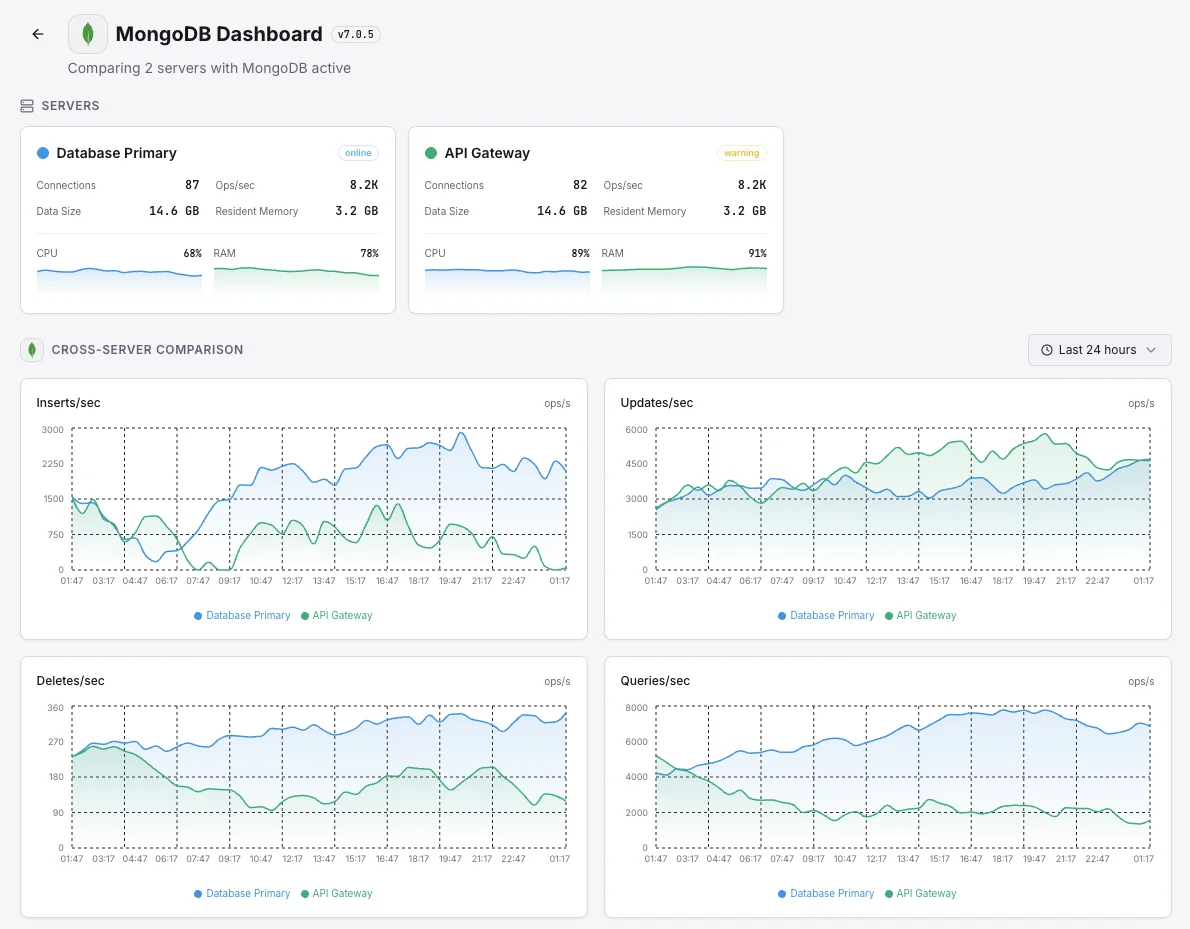
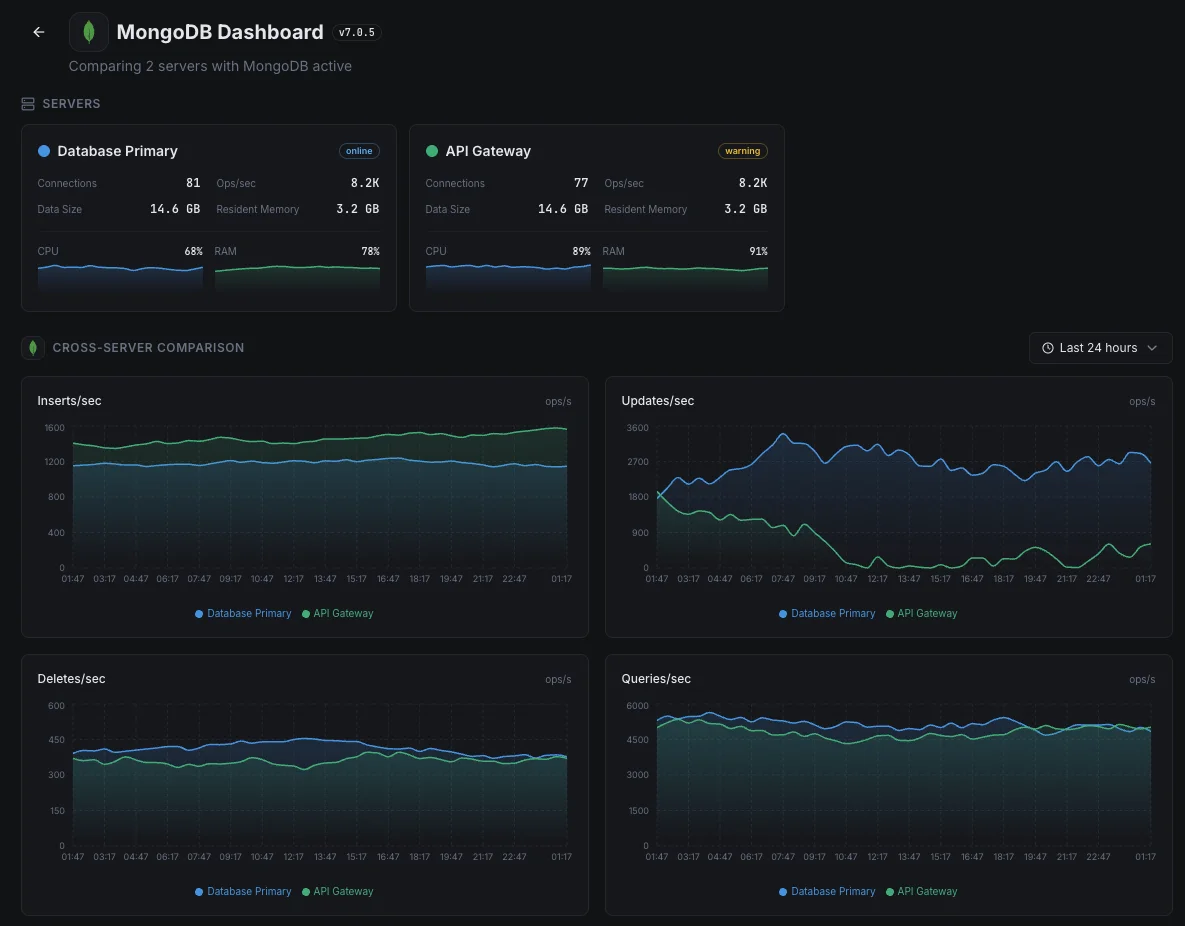
- Unified dashboard for servers, databases, and uptime
- Flexible alerting via Slack, PagerDuty, Telegram & more
- Historical data retention for capacity planning & audits
Common MongoDB monitoring scenarios
Where MongoDB typically runs today — and what could go wrong if no one's watching.
Self-hosted database with backup copies
Production setups run several copies of the database so a failure can't take the app down. When one copy quietly falls behind the others, the safety net is weaker than it looks. We catch the drift early so failover does what it's supposed to: stay invisible to users.
Databases split across multiple servers
When the data is too big for one server, it's split across many — but if some servers end up doing more work than others, the whole app slows down. We surface the imbalance so the team can rebalance the load before one overloaded server becomes a customer-facing problem.
The database behind a Node.js app
Most Node.js apps put a heavy load on MongoDB and reuse a pool of database connections to stay fast. When the app leaks connections or runs an inefficient query, every request slows down. We surface the cause quickly so the right team can fix it.
Prerequisites for MongoDB
Make sure you've got these in place — most installs are a 60-second job once they are.
- MongoDB 7.0 LTS or 8.0 LTS (4.x and 5.x/6.x also supported) running on the server
- A user with the
clusterMonitorrole (orreadAnyDatabase+clusterMonitorfor legacy versions) - Network reachability from Xitogent to every node you want to monitor (primary + secondaries + mongos + config servers for sharded clusters)
Get started in minutes
Install Xitogent on your server
If you haven't already, install the lightweight Xitogent monitoring agent on your server.
curl -s https://xitoring.com/install.sh | sudo bash -s -- --key=YOUR_API_KEYCreate a monitoring user in MongoDB
Create a dedicated MongoDB user with the `clusterMonitor` role so Xitogent can read serverStatus, replication state, and storage metrics:
use admin
db.createUser({
  user: "xitogent",
  pwd: "xitogent!",
  roles: [{ role: "clusterMonitor", db: "admin" }]
})Enable the MongoDB integration
Use the Xitoring dashboard or CLI to enable the MongoDB integration. Xitogent will auto-detect your MongoDB instance.
sudo xitogent integrateConfigure alert thresholds (optional)
Set custom thresholds for metrics like replication lag, connection count, or storage usage to get notified when something needs attention.
Verify it's working
Run this command on the server to confirm Xitogent picked up the integration. Fresh metrics will start streaming to your dashboard within ~30 seconds.
sudo xitogent statusConsidering alternatives?
See how Xitoring stacks up against the alternatives for MongoDB monitoring — flat pricing, deeper integrations, and one agent that covers your whole stack.


Frequently asked questions
What is MongoDB monitoring?
How do I monitor MongoDB replication lag?
What is the oplog window and why does it matter?
How do I detect slow MongoDB queries?
How do I monitor WiredTiger cache hit ratio and eviction pressure?
How do I monitor a MongoDB sharded cluster?
What is mongostat used for?
How do I monitor MongoDB Atlas vs self-hosted?
What MongoDB versions are supported?
Start monitoring MongoDB today
Set up in under 60 seconds. No credit card required. Full metrics from day one.
Start Free TrialKeep exploring