
KeyDB Monitoring
Monitor KeyDB multi-threaded performance, active-replica state, FLASH storage tier, and the full Redis-compatible `INFO` metric set (memory, hit rate, evictions, replication) in real time.
Why monitor KeyDB?
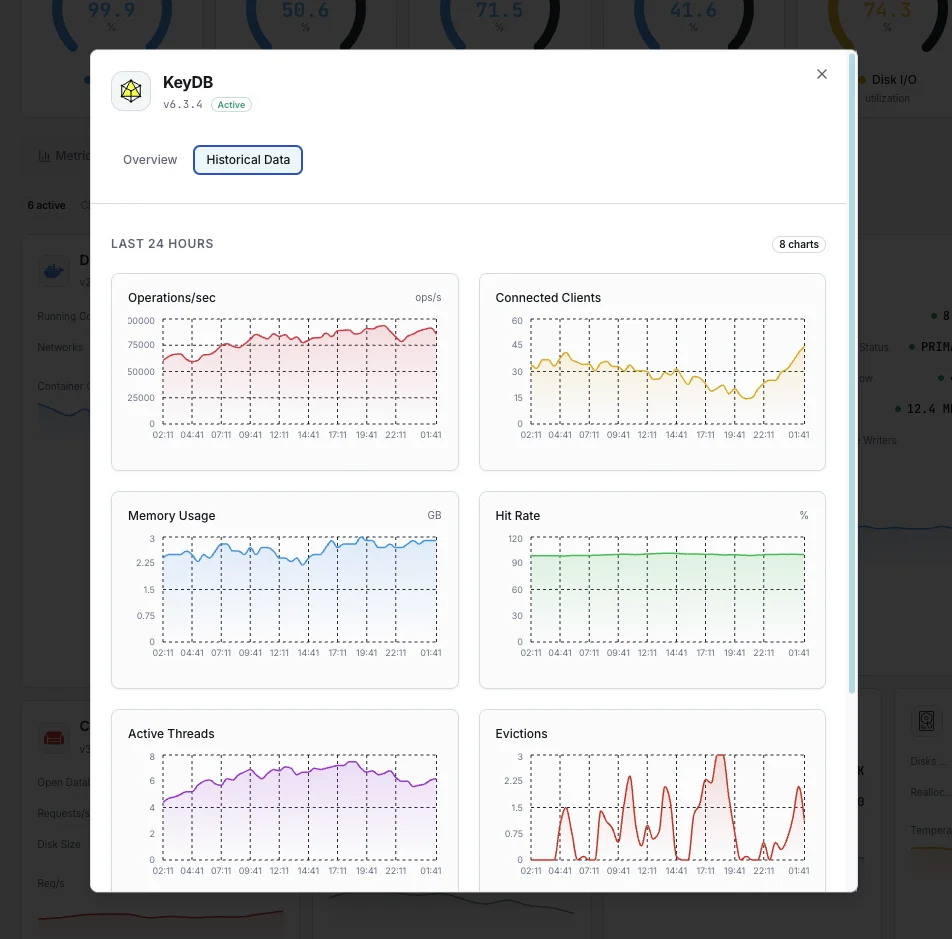
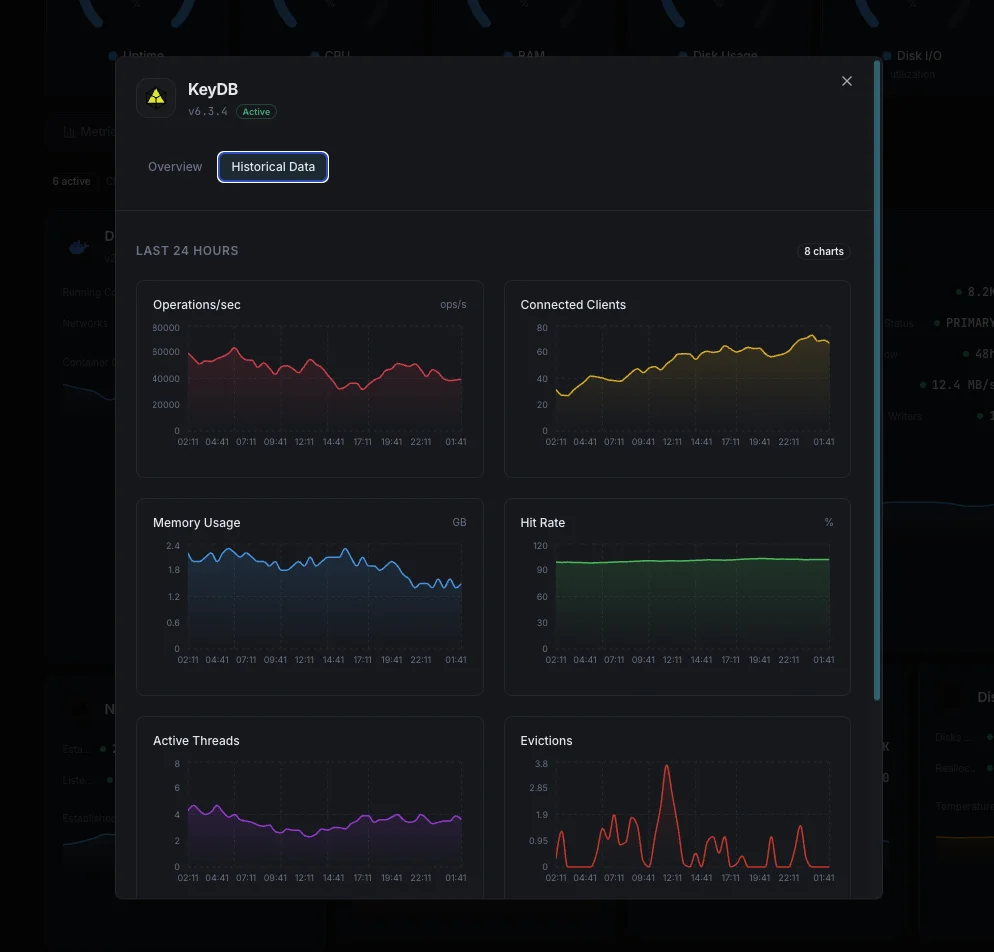
KeyDB is the multi-threaded Redis fork — used when one Redis core hits its CPU ceiling, or when active-active multi-master replication beats failover orchestration. Monitoring tracks the same things as Redis plus the KeyDB-specific signals: per-thread CPU distribution and FLASH tier hit rates that decide whether the multi-thread design pays off.
KeyDB monitoring, explained
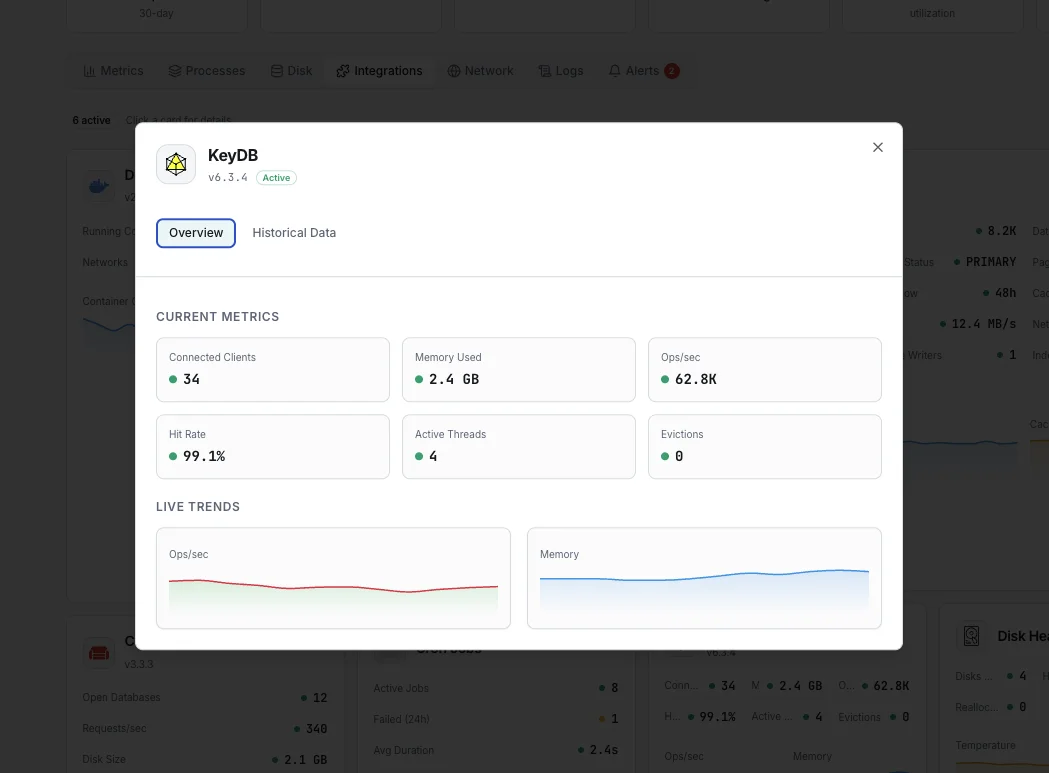
KeyDB monitoring catches memory pressure, replication divergence (especially in active-active multi-master setups), thread saturation, and FLASH storage tier issues before they impact cache performance or cause data drift across replicas. Because KeyDB is a drop-in Redis replacement with extra capabilities (multi-threading, active-active, FLASH SSD tier), monitoring it well means tracking both the standard Redis metric set AND the KeyDB-specific signals. Xitoring auto-discovers your KeyDB, reads INFO plus per-thread state, and routes alerts to Slack, PagerDuty, Telegram, or your existing on-call.
What we monitor
used_memory / mem_fragmentation_ratio
Resident memory used vs RSS overhead. Fragmentation ratio above 1.5 means significant overhead — run `MEMORY PURGE` or enable `activedefrag`.
instantaneous_ops_per_sec
Live RESP commands processed per second across all worker threads. The headline throughput number where KeyDB's multi-threading shines vs single-threaded Redis.
Per-Thread CPU (server-threads)
CPU utilization per KeyDB worker thread. Uneven distribution flags a sticky-connection or single-shard hot-key pattern that's defeating the multi-threaded design.
Keyspace Hit Ratio
Computed as `keyspace_hits / (keyspace_hits + keyspace_misses)`. Target 80%+ for cache workloads; below 50% means the cache isn't helping.
evicted_keys / sec
Keys removed by the `maxmemory` policy. Any non-zero rate means `maxmemory` is too small for the working set — grow it, or move data to FLASH tier if cost-sensitive.
connected_clients / blocked_clients
Currently connected clients and clients blocked on `BLPOP`/`BRPOP`/`WAIT`/etc. Connected_clients approaching `maxclients` triggers `rejected_connections`.
rejected_connections
Connection attempts dropped because `maxclients` was hit. Any growth signals app-side connection-pool leaks or traffic spikes.
Active-Replica State
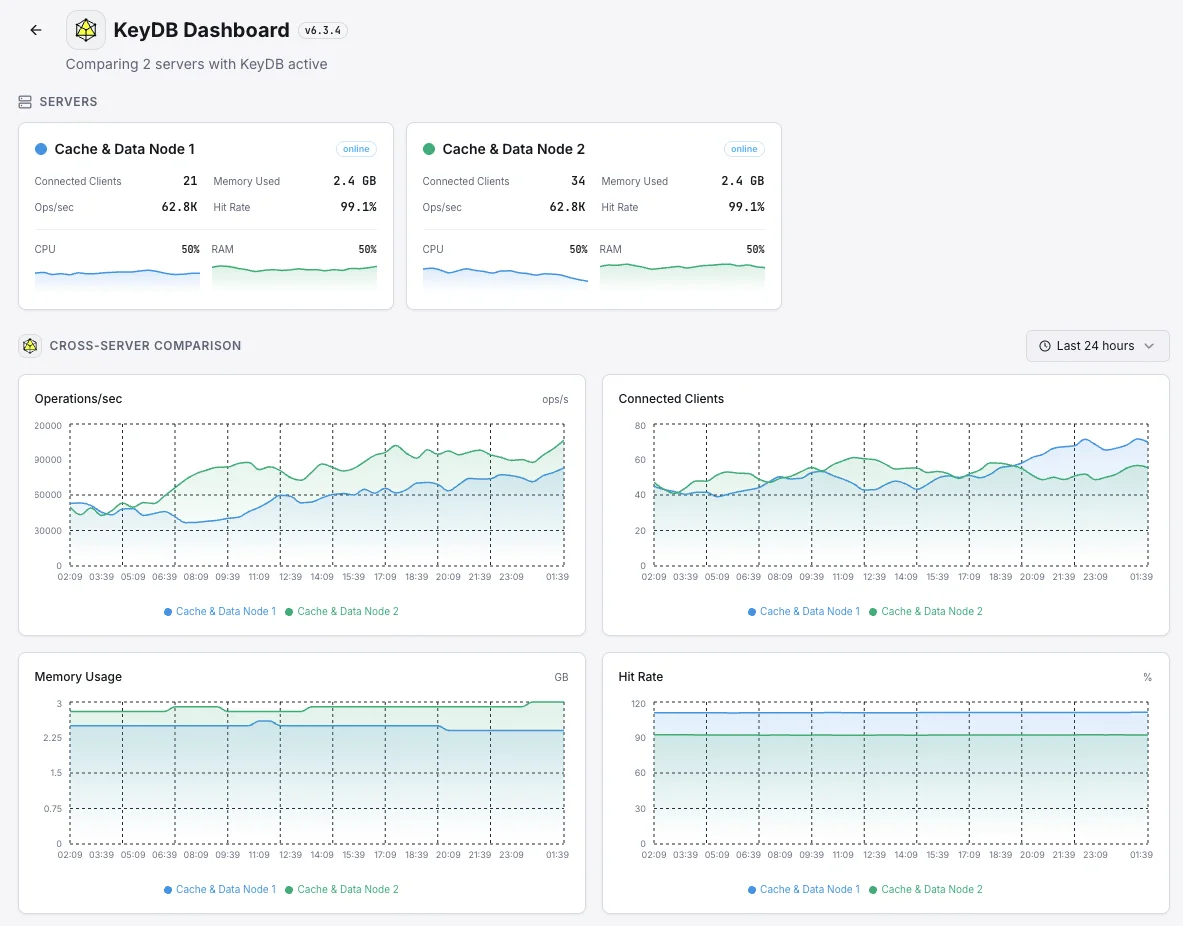
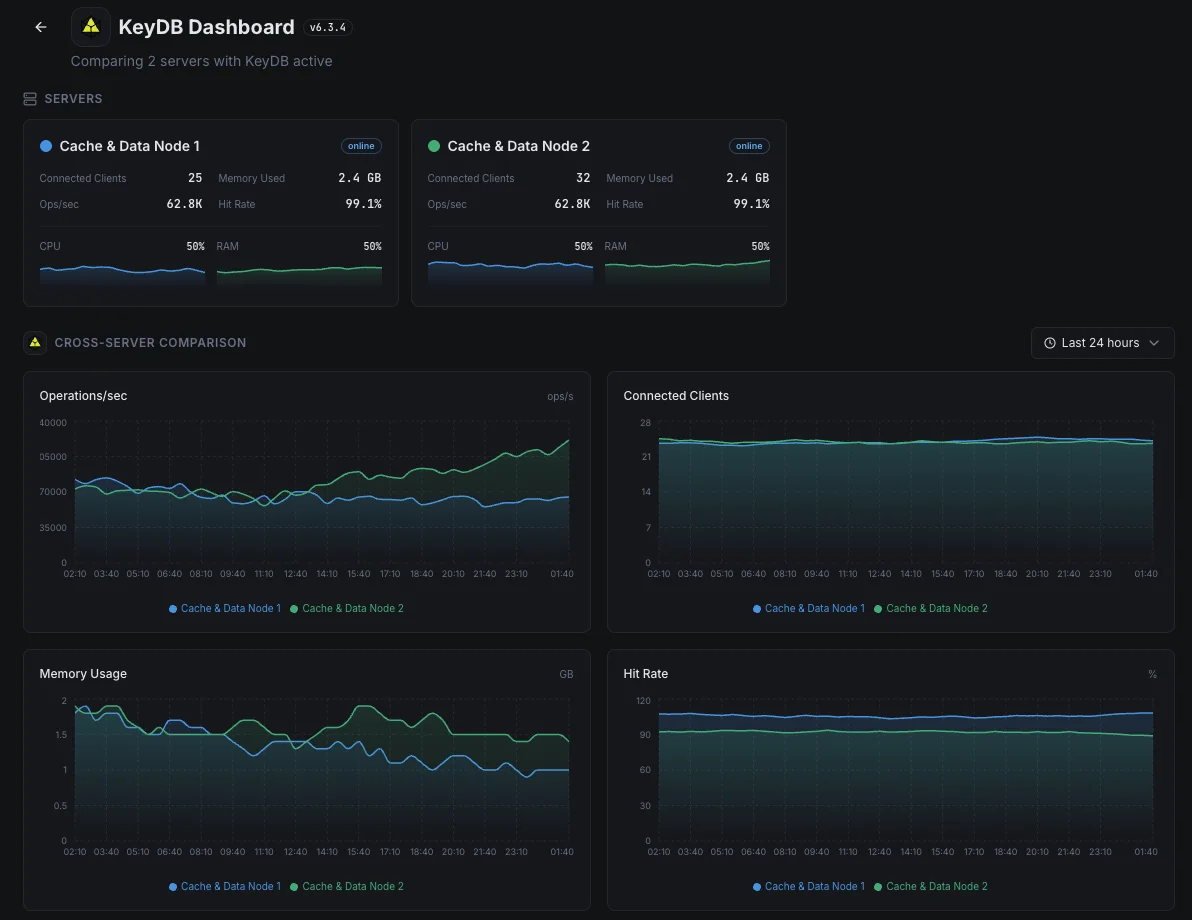
When `active-replica yes` is configured, surfaces per-replica replication offset and write-acceptance state — critical for multi-master deployments where every node accepts writes.
Replication Offset Lag
`master_repl_offset` minus `slave_repl_offset` per replica. Sustained lag means a replica can't keep up — usually network or CPU on the replica side.
FLASH Tier Hit/Miss
When `storage-provider flash` is enabled (KeyDB-specific SSD-backed tier), surfaces hot/warm/cold object split and FLASH miss rate. Lets you size the FLASH tier correctly for working sets larger than RAM.
Persistence (RDB / AOF)
`rdb_last_save_time`, `rdb_changes_since_last_save`, `aof_current_size`, `aof_rewrite_in_progress`. Detects failed RDB saves and AOF rewrite stalls before they impact restart recoverability.
SLOWLOG / Latency
Slow command count from `SLOWLOG` plus Redis-internal latency events from `LATENCY HISTORY`. Catches the one `KEYS *` or huge `SMEMBERS` call that's stalling worker threads.
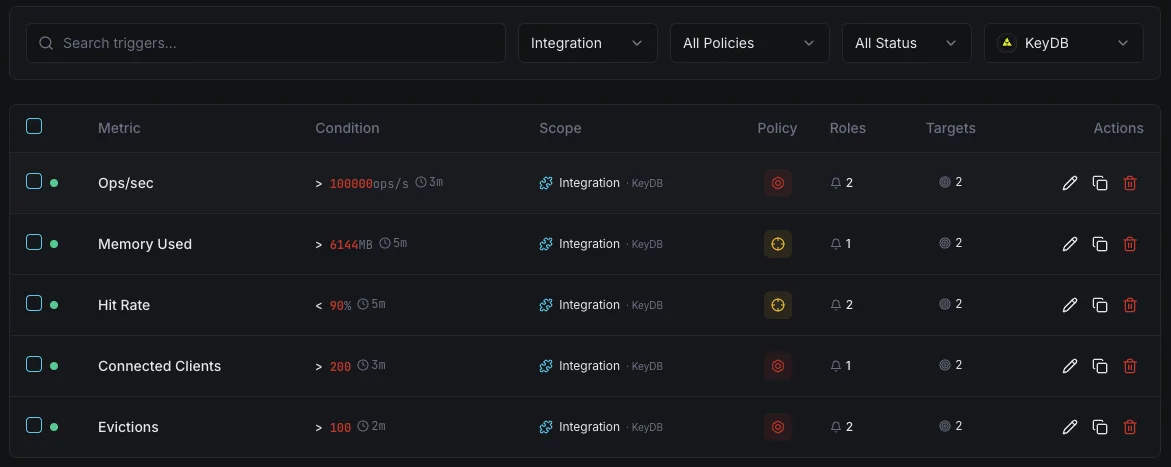
Configurable alert triggers
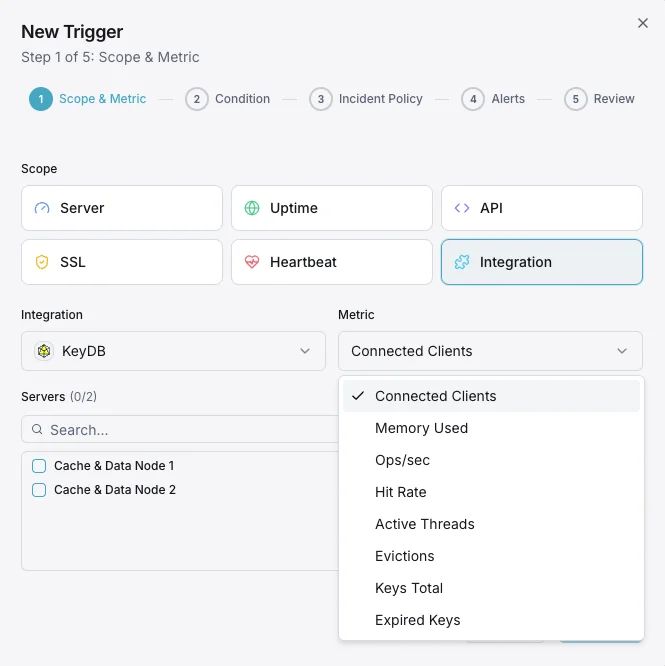
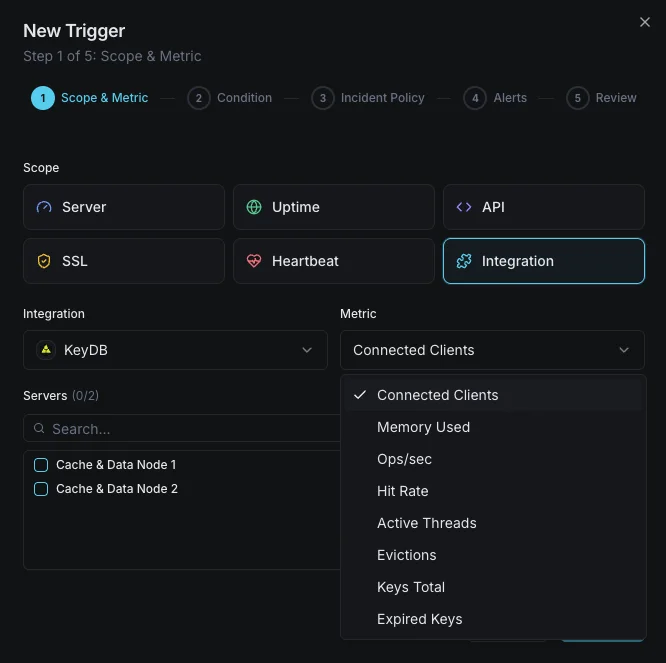
Set up custom triggers in your dashboard to get notified the moment KeyDB metrics cross your defined thresholds.
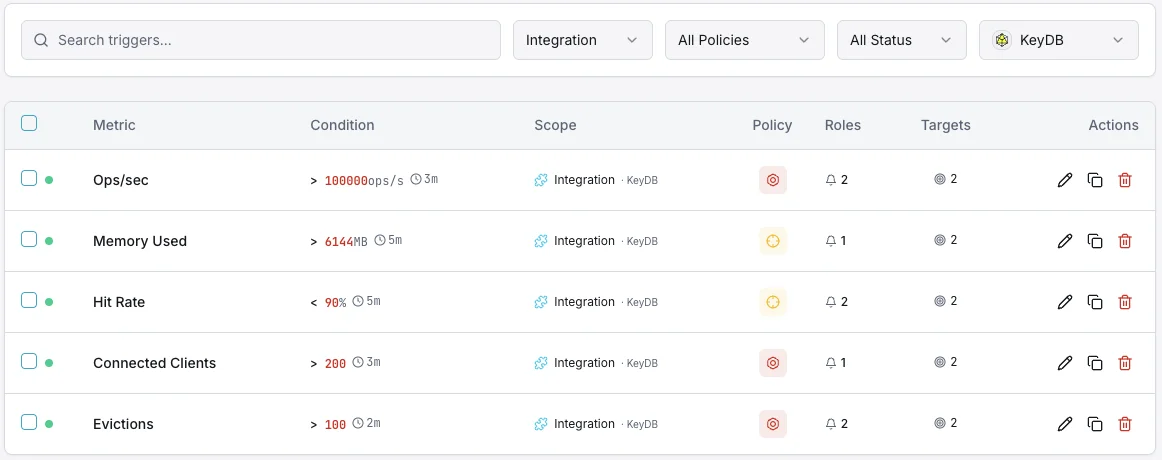
Memory Usage
criticalFires when memory exceeds threshold.
Replication Lag
criticalAlerts on replication falling behind.
Key Evictions
warningTriggers on high eviction rate.
Connected Clients
warningFires when client count approaches limits.
Importance of KeyDB Monitoring
KeyDB's multi-threaded architecture handles massive throughput. Without monitoring, memory pressure and replication issues can cause data loss.
- Track memory to prevent OOM crashes
- Monitor replication for data consistency
- Detect key evictions impacting cache
- Optimize multi-threaded performance
Why Choose Xitoring
Zero-config KeyDB monitoring.
- One-command install
- Global nodes
- Unified dashboard
- Multi-channel alerts
- Historical retention
Common KeyDB monitoring scenarios
Where KeyDB typically runs today — and what could go wrong if no one's watching.
High-traffic apps that outgrew Redis
KeyDB is usually chosen when one Redis server can no longer keep up with traffic. We make sure the extra power is actually being used — and flag the patterns that quietly cancel it out, so the upgrade pays off the way it was supposed to.
Apps serving users in multiple regions
When a cache runs in several regions and accepts writes everywhere, the regions can quietly drift apart. We watch for that drift so users in different parts of the world never see inconsistent data.
Large caches that mix memory and SSD
When the cache is too big to fit in memory, KeyDB stores the most-used items in RAM and the rest on disk. We watch the balance so the cache stays fast — and so the SSDs underneath don't quietly wear out from heavy use.
Prerequisites for KeyDB
Make sure you've got these in place — most installs are a 60-second job once they are.
- KeyDB 5.x or 6.x running on its configured port (default 6379)
- AUTH password if
requirepassis set (ACL also supported) - Network reachability from Xitogent to the KeyDB instance (or each node in active-replica deployments)
Get started in minutes
Install Xitogent on your KeyDB host
Install the lightweight Xitogent monitoring agent on the host running KeyDB.
curl -s https://xitoring.com/install.sh | sudo bash -s -- --key=YOUR_API_KEYConfirm INFO command access
KeyDB is wire-compatible with Redis and uses the `INFO` command for runtime stats. Ensure KeyDB is reachable on its bind address (default 6379) and supply credentials if `requirepass` is set.
sudo xitogent integrateEnable the KeyDB integration
Use the Xitoring dashboard or CLI to enable the KeyDB integration. Xitogent auto-detects your KeyDB instance and replication topology.
Configure alert thresholds (optional)
Set custom thresholds for Memory Usage, Replication Lag, or Key Evictions to catch capacity issues before they cause cache misses or replication divergence.
Verify it's working
Run this command on the server to confirm Xitogent picked up the integration. Fresh metrics will start streaming to your dashboard within ~30 seconds.
sudo xitogent statusConsidering alternatives?
See how Xitoring stacks up against the alternatives for KeyDB monitoring — flat pricing, deeper integrations, and one agent that covers your whole stack.



Frequently asked questions
What is KeyDB and how does it differ from Redis?
How do I monitor KeyDB latency?
How do I monitor KeyDB active-replica replication?
How many server-threads should I set in KeyDB?
Is KeyDB really 5x faster than Redis?
How do I monitor KeyDB FLASH storage?
Does KeyDB work with, Prometheus, and Grafana?
KeyDB vs Valkey vs Redis — which to monitor in 2026?
What KeyDB versions are supported?
Start monitoring KeyDB today
Set up in under 60 seconds. No credit card required. Full metrics from day one.
Start Free TrialKeep exploring


