Memcached Monitoring
Monitor Memcached `get_hits`/`get_misses` hit ratio, `evictions`, `bytes` used vs `limit_maxbytes`, `curr_connections`, and `listen_disabled_num` in real time — via the native `stats` command.
Why monitor Memcached?
Memcached is the lean cache when you don't need Redis's data structures — WordPress object cache, PHP sessions, Django/Rails query results. When evictions climb or memory fills, your DB gets hammered by what used to be cache hits. Monitoring catches eviction storms before they cascade into database overload.
Memcached monitoring, explained
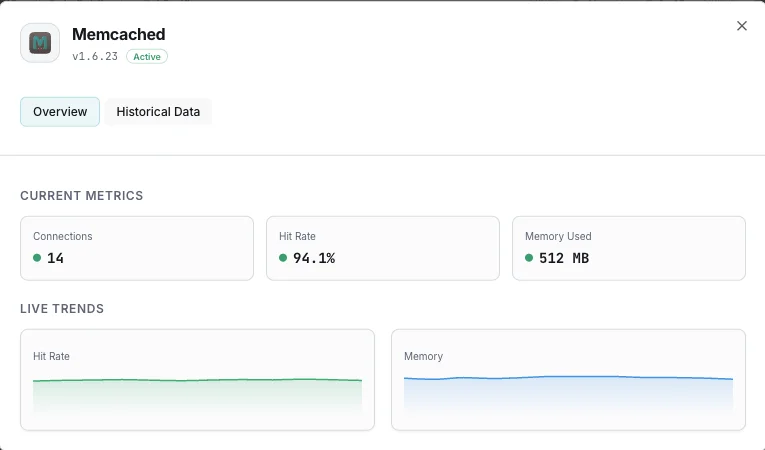
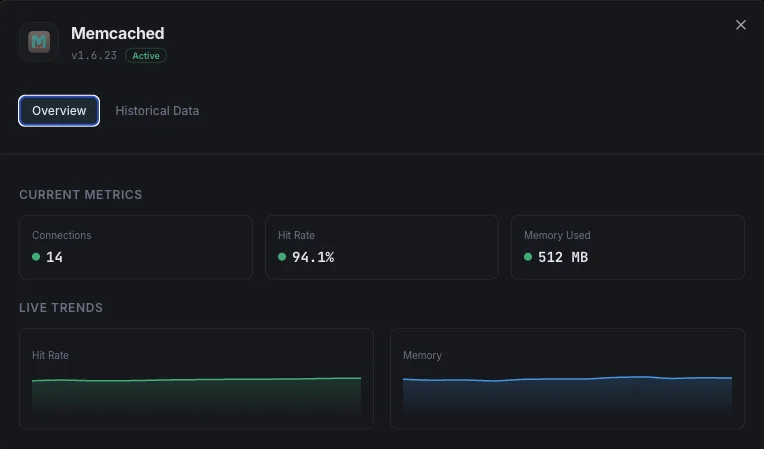
Memcached monitoring catches eviction storms, memory pressure, connection saturation, and degrading hit ratios before they cause uncached requests to hammer your database. For WordPress object cache, PHP sessions, Django/Rails query result caching, and AWS ElastiCache Memcached deployments, per-node visibility is what separates a 60-second alert from finding your DB pegged at 100% CPU at 3am. Xitoring auto-discovers your Memcached, reads stats on a 1-minute interval, and routes alerts to Slack, PagerDuty, Telegram, or your existing on-call.
What we monitor
Used Memory
Total memory currently allocated for cached items.
Max Memory
Maximum memory limit configured for the Memcached instance.
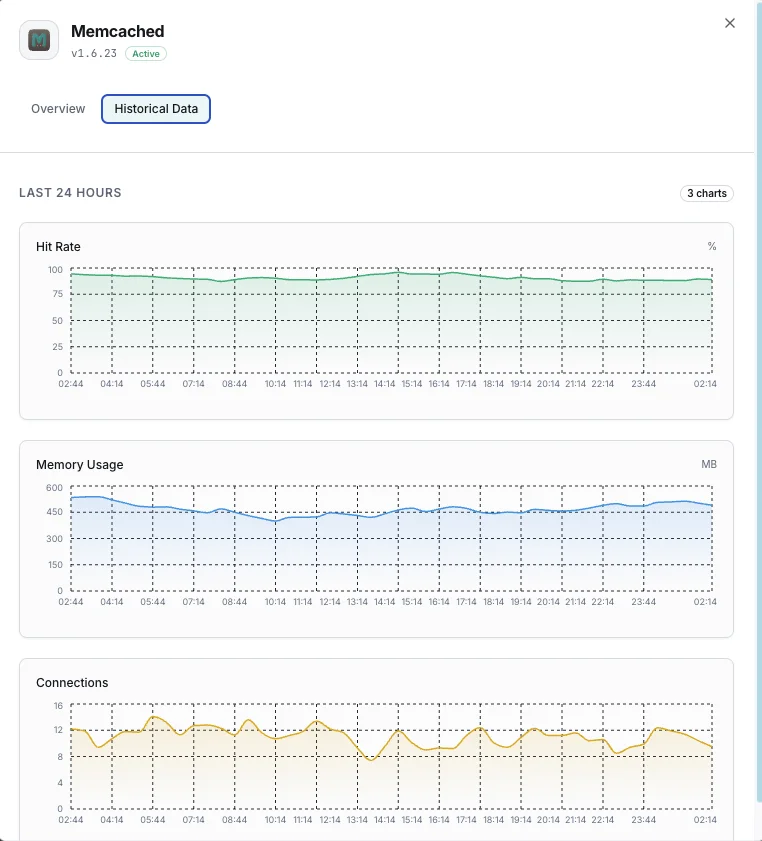
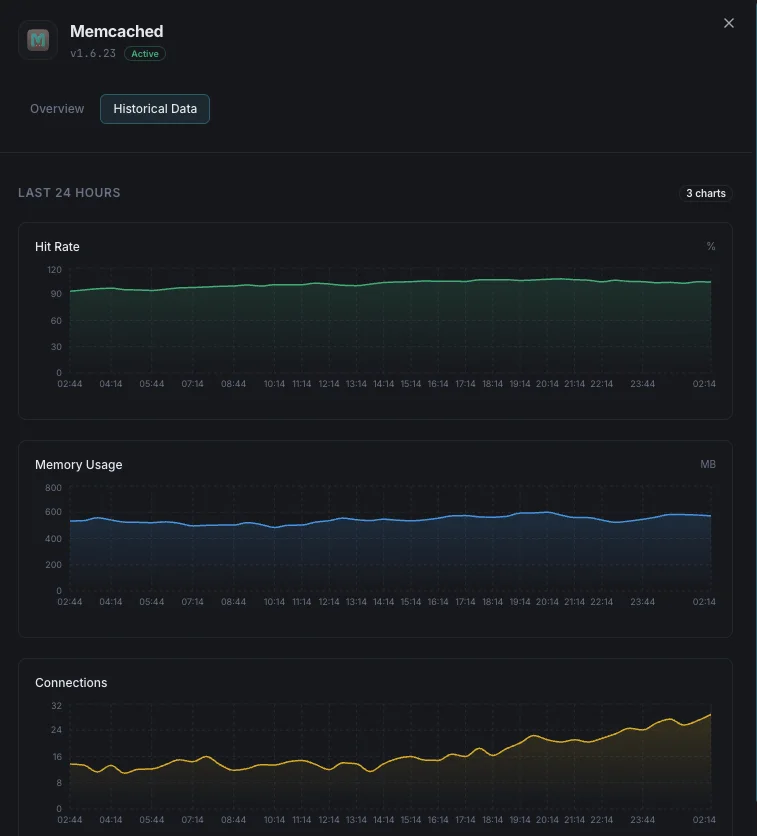
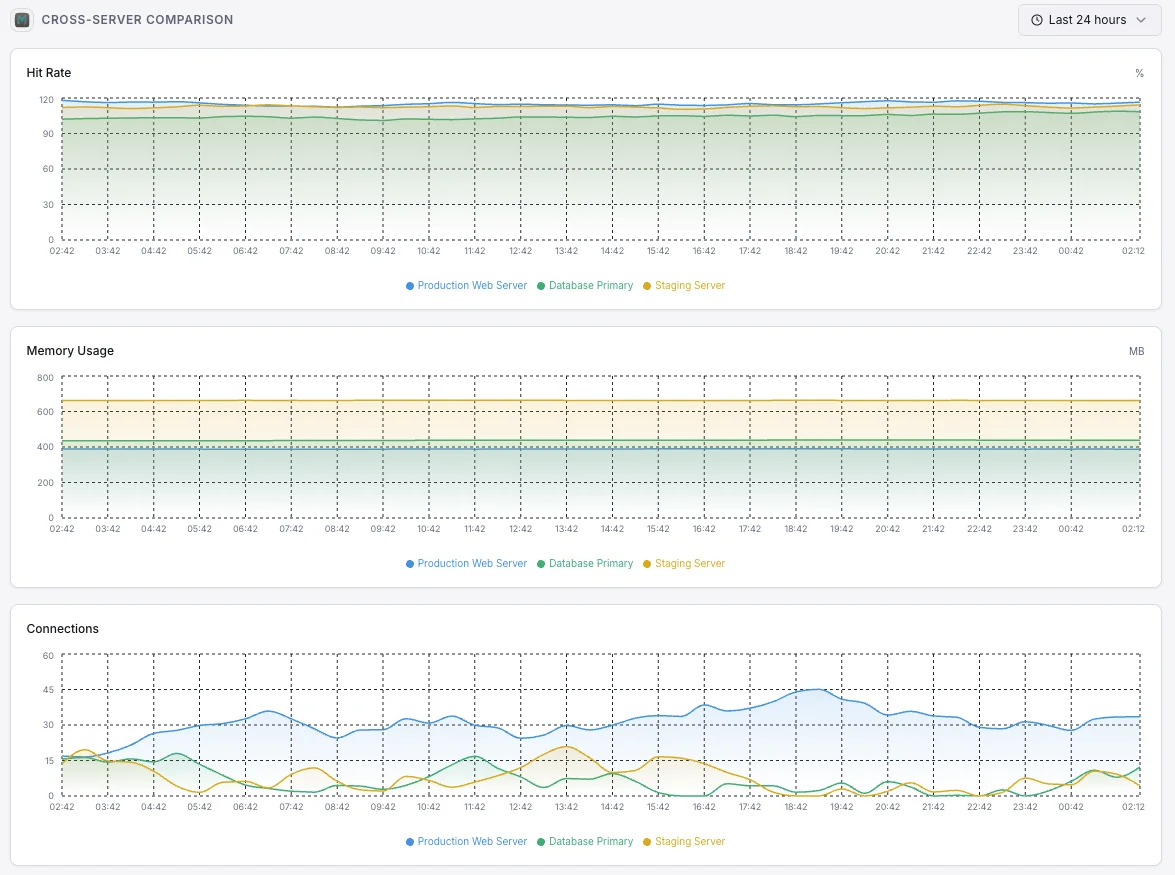
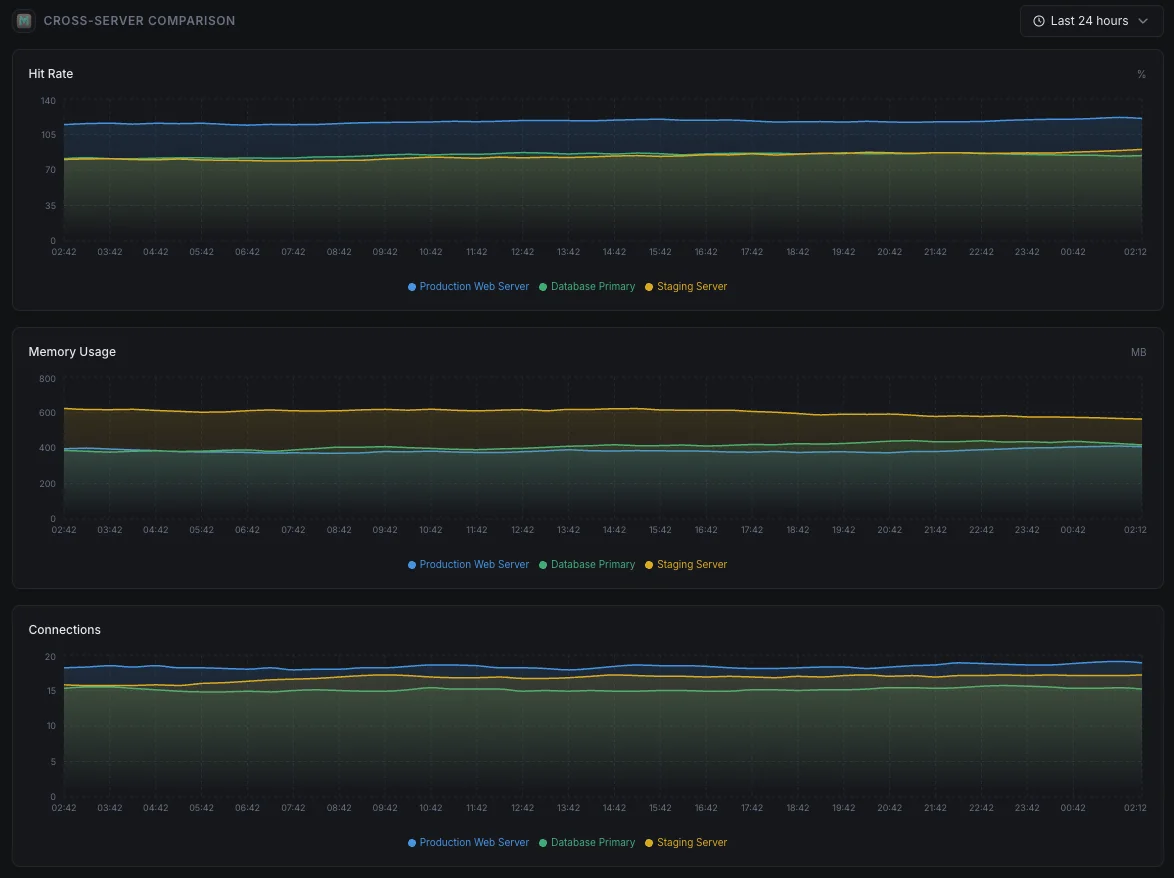
Hit Rate
Percentage of successful cache lookups vs misses, indicating cache effectiveness.
Evictions
Number of items evicted to make room for new data.
Current Connections
Number of currently open client connections.
Items Stored
Total number of items currently stored in cache.
Get/Set Ratio
Ratio of get to set commands, indicating read/write balance.
Bytes Read/Written
Total network throughput for the Memcached instance.
CAS Hits/Misses
Check-and-set operation success rates for concurrent updates.
Slab Utilization
Memory allocation efficiency across slab classes.
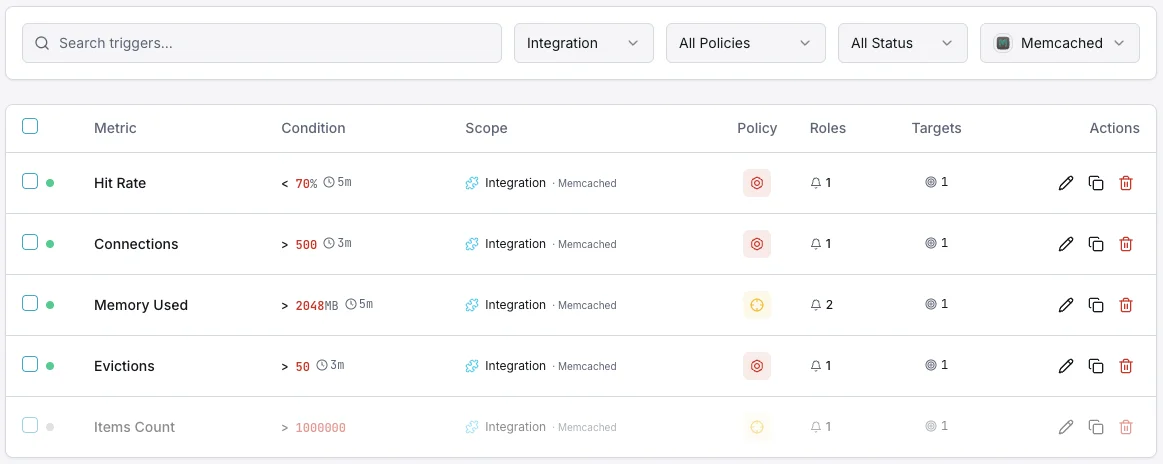
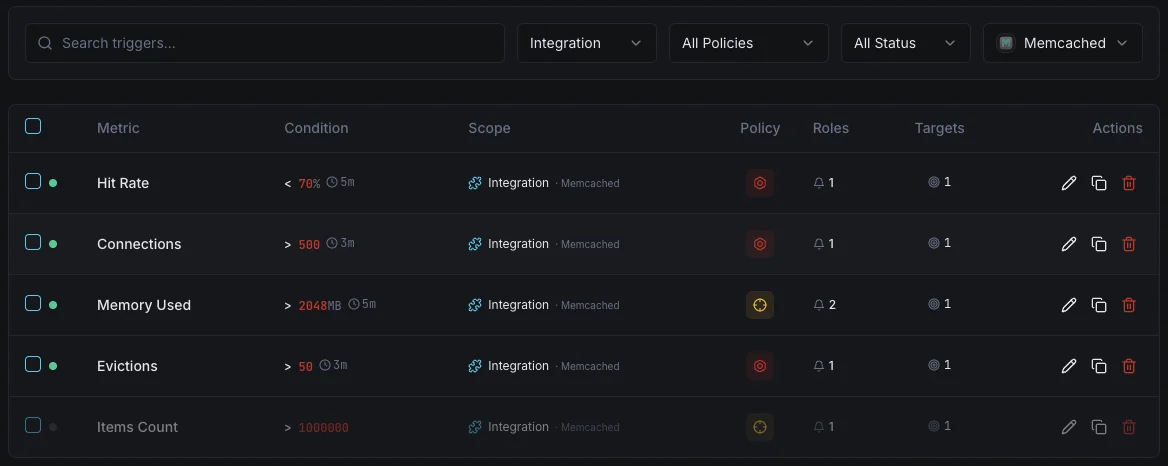
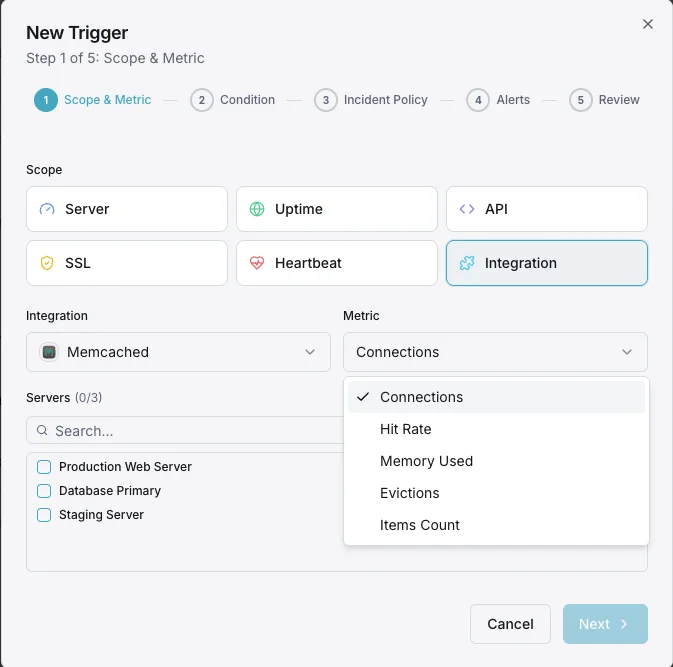
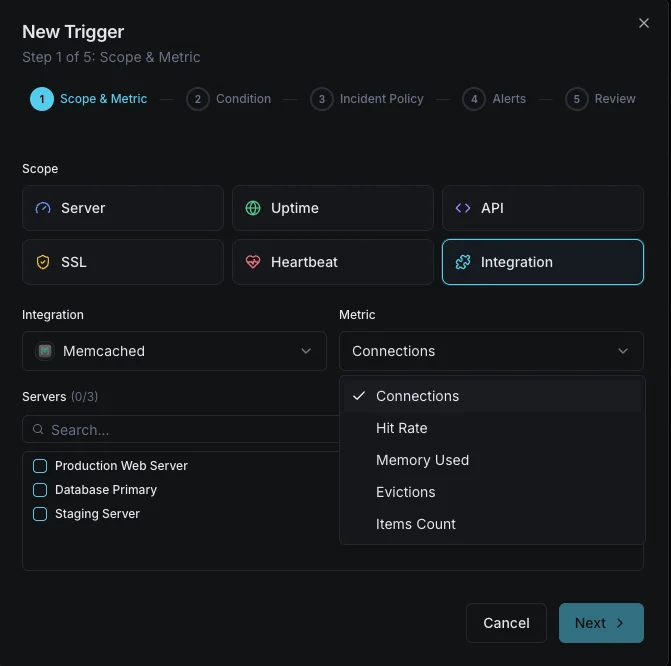
Configurable alert triggers
Set up custom triggers in your dashboard to get notified the moment Memcached metrics cross your defined thresholds.
Memory Usage
criticalFires when Memcached memory consumption approaches the configured limit, risking evictions.
Hit Rate Drop
warningAlerts when cache hit rate drops below threshold, indicating cache inefficiency or working set changes.
Eviction Rate
criticalFires when eviction rate spikes, meaning Memcached is actively removing data to stay within memory limits.
Connection Count
warningTriggers when client connections exceed the threshold, indicating potential connection leaks.
Items Reclaimed
warningAlerts when expired items are being reclaimed at a high rate, suggesting TTL misconfiguration.
Importance of Memcached Monitoring
Memcached silently powers your application's performance layer. Without monitoring, memory exhaustion, eviction storms, and connection leaks can degrade your entire application stack before anyone notices.
- Detect memory pressure before evictions impact application performance
- Monitor cache hit rates to ensure optimal response times
- Track eviction patterns to right-size your memory allocation
- Identify connection leaks from application clients
- Ensure consistent cache performance across distributed nodes
Why Choose Xitoring
Xitoring delivers enterprise-grade Memcached monitoring with zero-config setup. Our lightweight agent auto-discovers your Memcached instances, starts collecting metrics in under 60 seconds, and integrates with your existing notification channels.
- One-command install — no complex YAML or config files
- 15+ global monitoring nodes for low-latency checks
- Unified dashboard for servers, caches, and uptime
- Flexible alerting via Slack, PagerDuty, Telegram & more
- Historical data retention for capacity planning & audits
Common Memcached monitoring scenarios
Where Memcached typically runs today — and what could go wrong if no one's watching.
Speeding up WordPress and PHP sites
Memcached keeps WordPress and PHP sites fast by remembering the results of repeated work. When the cache stops paying off, the site quietly gets slow under load. We surface that early so visitors and conversions aren't quietly affected.
Speeding up web apps and APIs
Web apps put their most expensive results in the cache so they don't have to compute them on every request. When the cache fills up or starts thrashing, the original work comes flooding back to the database. We catch the moment the cache stops protecting your app so the team can step in before users feel it.
Managed cache running in the cloud
Cloud providers handle the servers, but they don't tell you when your own use of the cache is becoming inefficient — running out of memory, hitting connection limits, or evicting useful data. We close that gap so you keep control of cost and performance.
Prerequisites for Memcached
Make sure you've got these in place — most installs are a 60-second job once they are.
- Memcached 1.6.x (current) or 1.4.x running on its configured port (default 11211)
- Network reachability from Xitogent to the Memcached instance (
telnet host 11211+statsto verify) statscommand accessible (no AUTH required by default; SASL supported when enabled)
Get started in minutes
Install Xitogent on your server
If you haven't already, install the lightweight Xitogent monitoring agent on your server.
curl -s https://xitoring.com/install.sh | sudo bash -s -- --key=YOUR_API_KEYEnsure Memcached stats are accessible
Xitogent uses the Memcached stats command to collect metrics. Verify your instance is reachable locally:
echo 'stats' | nc localhost 11211 | head -10Enable the Memcached integration
Use the Xitoring dashboard or CLI to enable the Memcached integration. Xitogent will auto-detect your instance.
sudo xitogent integrateConfigure alert thresholds (optional)
Set custom thresholds for metrics like memory usage, hit rate, or eviction count to get notified when something needs attention.
Verify it's working
Run this command on the server to confirm Xitogent picked up the integration. Fresh metrics will start streaming to your dashboard within ~30 seconds.
sudo xitogent statusConsidering alternatives?
See how Xitoring stacks up against the alternatives for Memcached monitoring — flat pricing, deeper integrations, and one agent that covers your whole stack.


Frequently asked questions
What is Memcached monitoring?
How do I monitor Memcached hit ratio?
What do high evictions mean in Memcached?
How do I detect Memcached memory pressure?
How do I monitor Memcached connection limits?
Memcached vs Redis — which to choose?
How do I run `stats` against Memcached?
How do I monitor a Memcached cluster?
What Memcached versions are supported?
Start monitoring Memcached today
Set up in under 60 seconds. No credit card required. Full metrics from day one.
Start Free Trial