MSSQL Monitoring
Monitor SQL Server Page Life Expectancy, Buffer Cache Hit Ratio, top wait stats (CXPACKET, PAGEIOLATCH, LCK_M_*), deadlocks, Always On AG send/redo queue, and Query Store regressions in real time.
Why monitor MSSQL?
SQL Server runs enterprise OLTP, ERP, Dynamics 365, SharePoint, and legacy WCF workloads. Blocking chains, deadlock storms, Always On AG drift, and Query Store plan regressions show up as 'the app is slow' long before they're traceable. Monitoring exposes the actual wait stat, the actual deadlock graph, the actual regressed query.
SQL Server monitoring, explained
SQL Server monitoring catches blocking chains, deadlock storms, Always On AG drift, memory pressure, and Query Store plan regressions before they cause user-visible slowness or HA failover events. For Dynamics 365, SharePoint, ERP, and any enterprise SQL workload, per-database wait-stats and Query Store visibility is what separates a clean tuning fix from a multi-day root-cause chase. Xitoring auto-discovers your SQL Server, reads native DMVs with the VIEW SERVER STATE permission, and routes alerts to Slack, PagerDuty, Telegram, or your existing on-call.
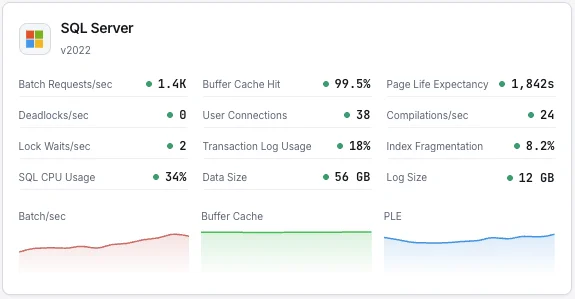
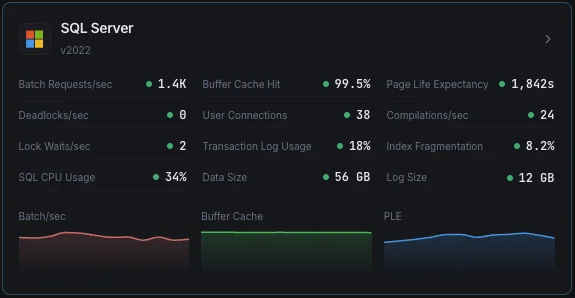
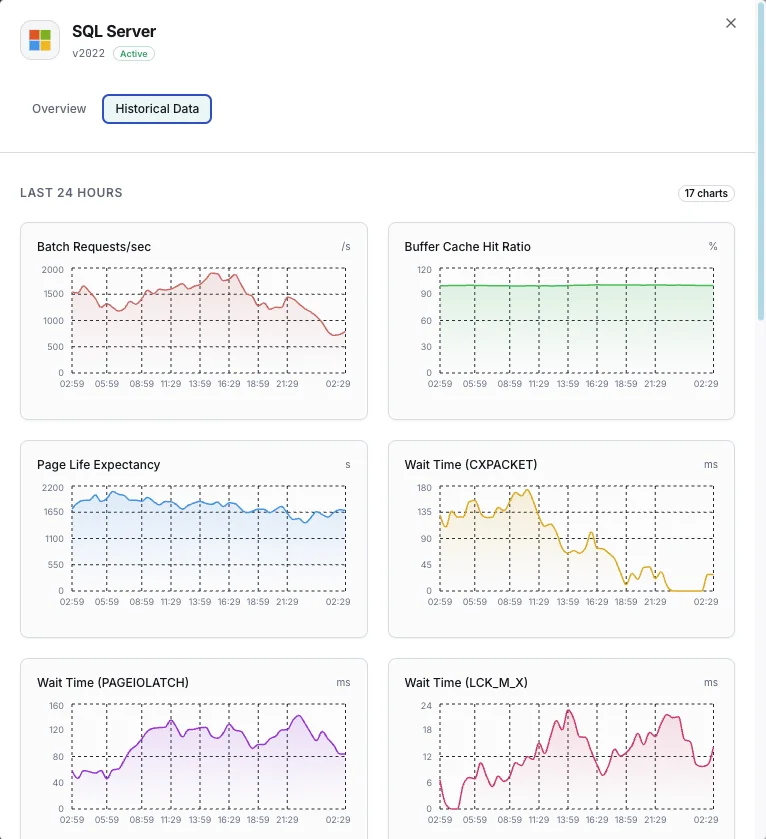
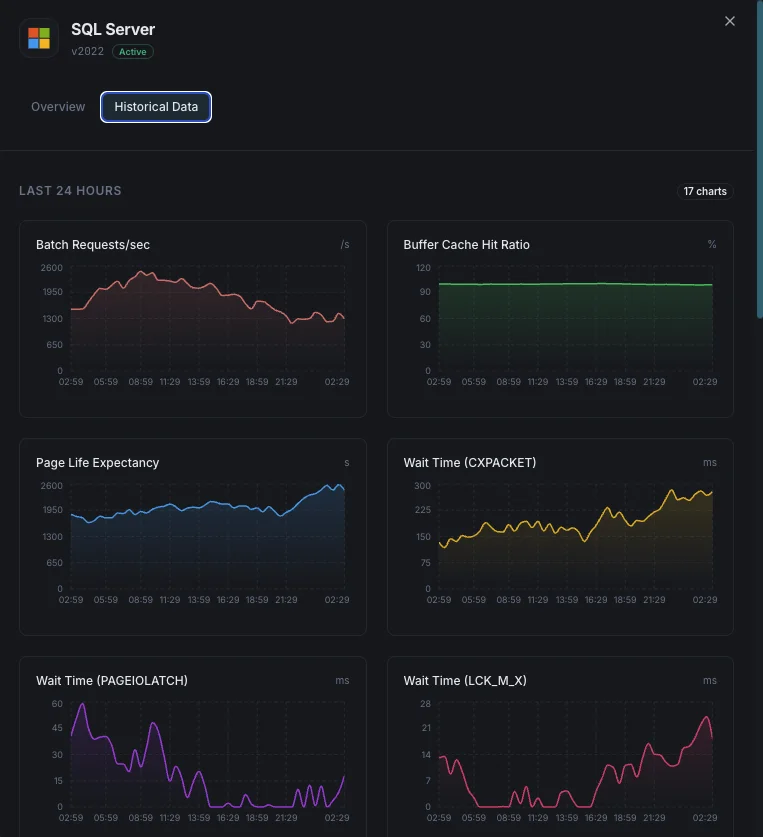
What we monitor
Batch Requests/sec
Number of SQL batch requests received per second.
Buffer Cache Hit Ratio
Percentage of page reads satisfied from buffer pool vs physical disk reads.
Page Life Expectancy
Average time (seconds) a page stays in the buffer pool — lower values indicate memory pressure.
Wait Statistics
Top wait types and durations indicating resource bottlenecks.
Deadlocks/sec
Number of lock requests that resulted in deadlocks.
Transaction Log Usage
Percentage of transaction log space used per database.
User Connections
Number of active user connections to the SQL Server instance.
Compilations/sec
Number of SQL compilations and recompilations per second.
Lock Waits/sec
Number of lock requests that required the caller to wait.
Index Fragmentation
Fragmentation level of indexes across databases.
CPU Usage
SQL Server process CPU utilization vs total system CPU.
Database Size
Data and log file sizes for each database.
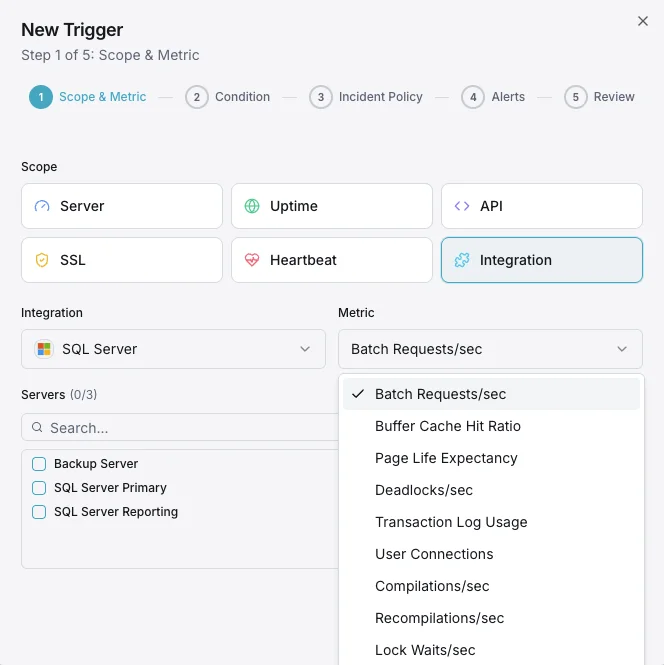
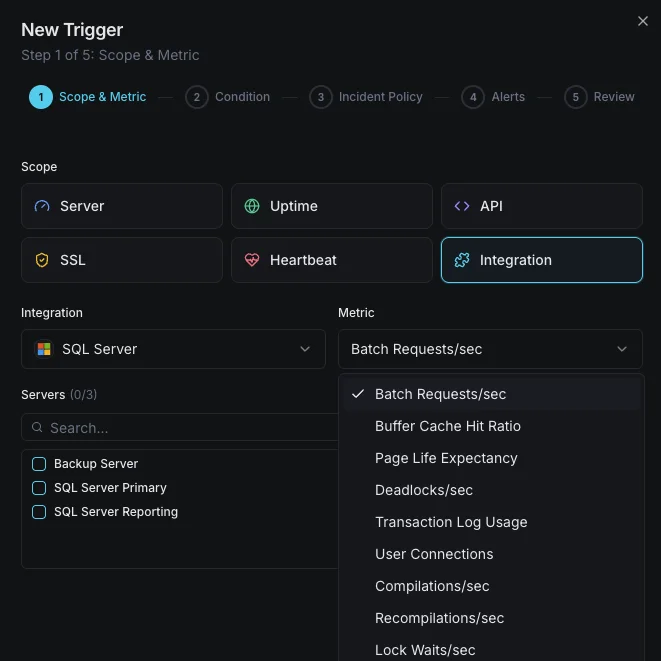
Configurable alert triggers
Set up custom triggers in your dashboard to get notified the moment MSSQL metrics cross your defined thresholds.
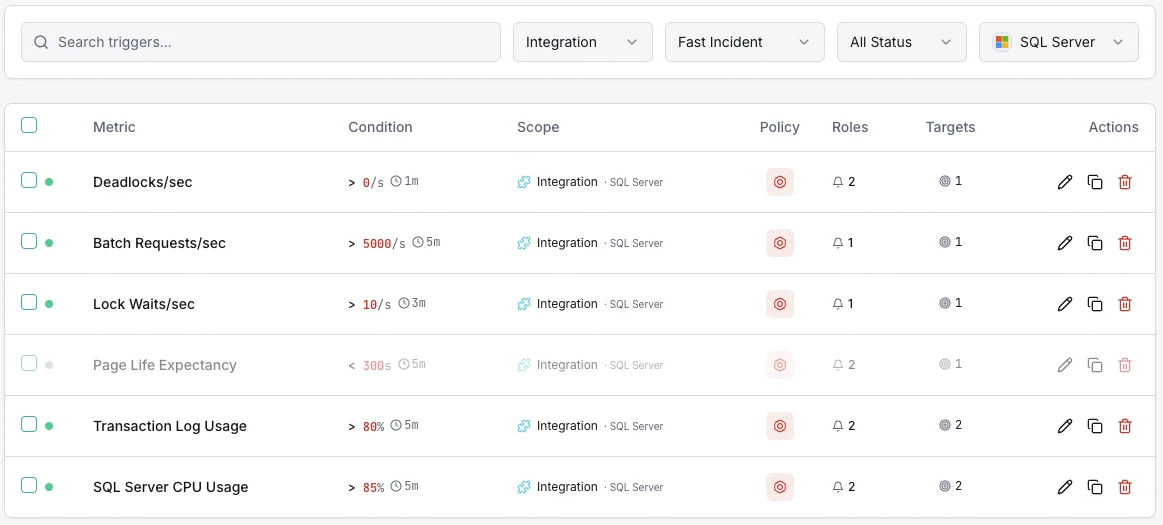
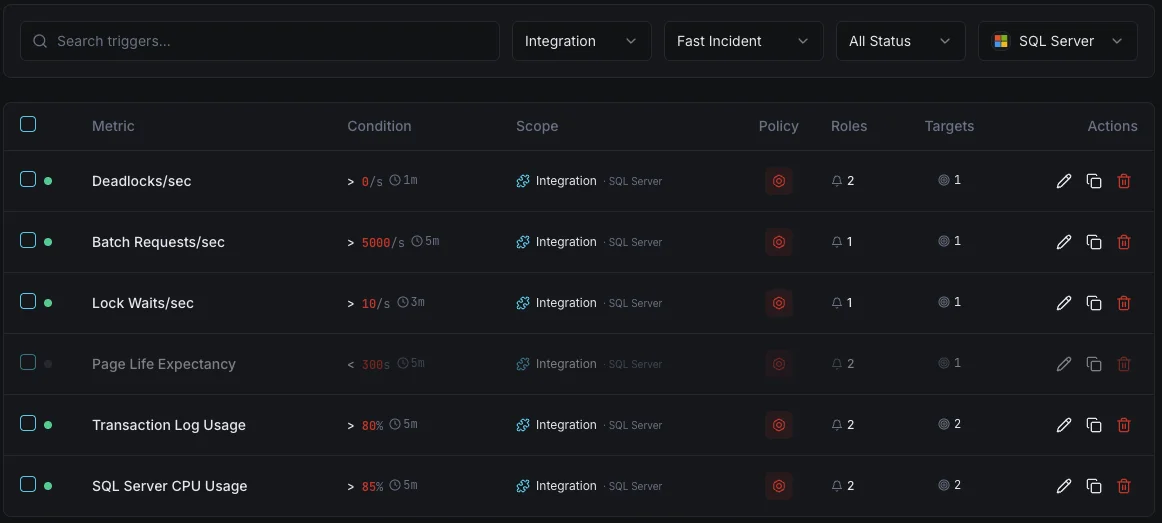
Buffer Cache Hit Ratio
criticalFires when cache hit ratio drops below threshold, indicating insufficient memory for workload.
Page Life Expectancy
warningTriggers when PLE drops below threshold, meaning pages are being flushed too quickly from memory.
Deadlocks
criticalAlerts when deadlock rate exceeds threshold, indicating lock contention in application queries.
Transaction Log Usage
criticalFires when transaction log usage exceeds threshold, risking write failures.
User Connections
warningTriggers when connection count approaches limits, risking connection refused errors.
Wait Statistics
warningAlerts when specific wait types spike, indicating resource bottlenecks (CPU, I/O, memory, locks).
Importance of MSSQL Monitoring
SQL Server runs mission-critical enterprise workloads — from ERP systems and financial databases to e-commerce platforms. Without monitoring, buffer pressure, deadlocks, and transaction log bloat can cause outages and data corruption.
- Detect memory pressure through buffer cache and PLE metrics
- Monitor wait statistics to identify the root cause of slowdowns
- Track deadlocks to fix application-level locking issues
- Ensure transaction log space for uninterrupted write operations
- Optimize index usage to maintain query performance over time
Why Choose Xitoring
Xitoring delivers enterprise-grade SQL Server monitoring with zero-config setup. Our lightweight agent auto-discovers your MSSQL instances, starts collecting metrics in under 60 seconds, and integrates with your existing notification channels.
- Native Windows Server support with easy installer
- 15+ global monitoring nodes for low-latency checks
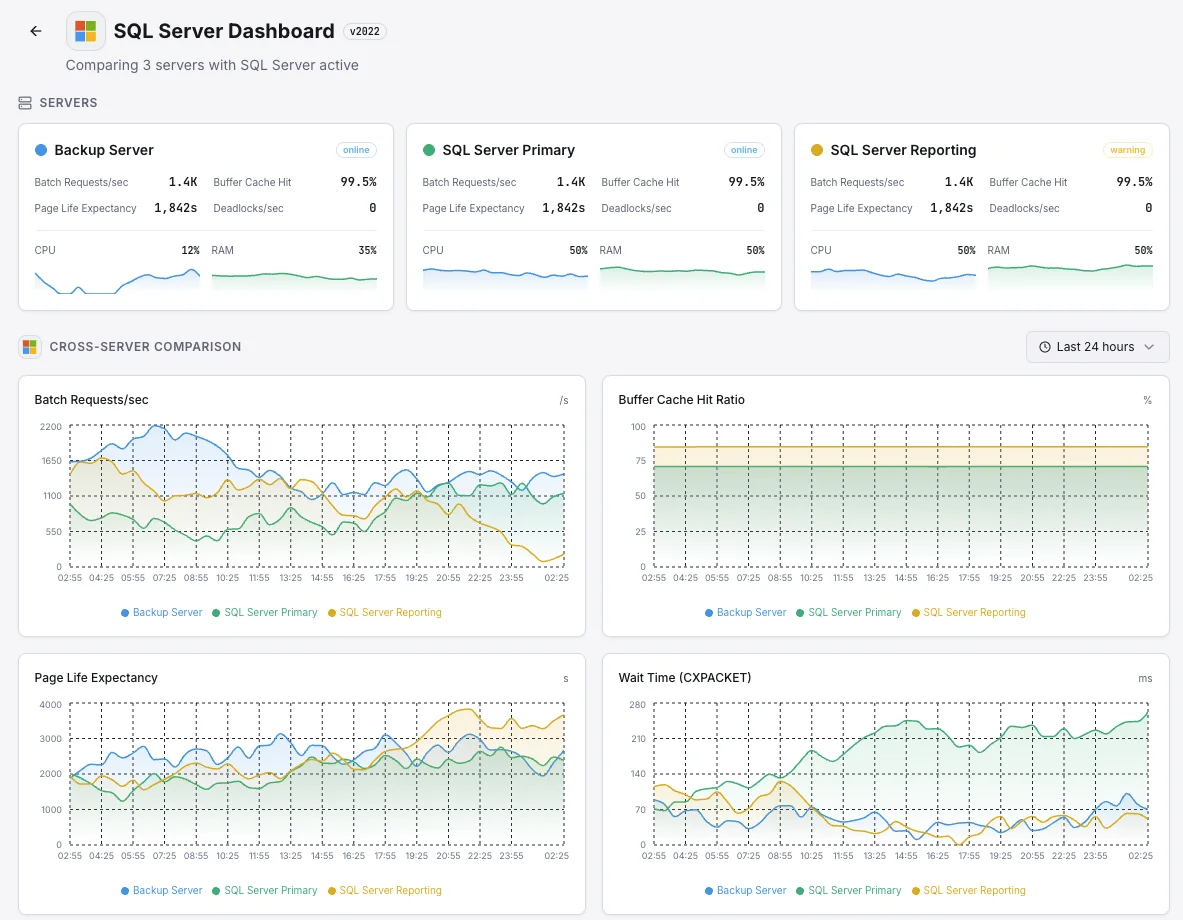
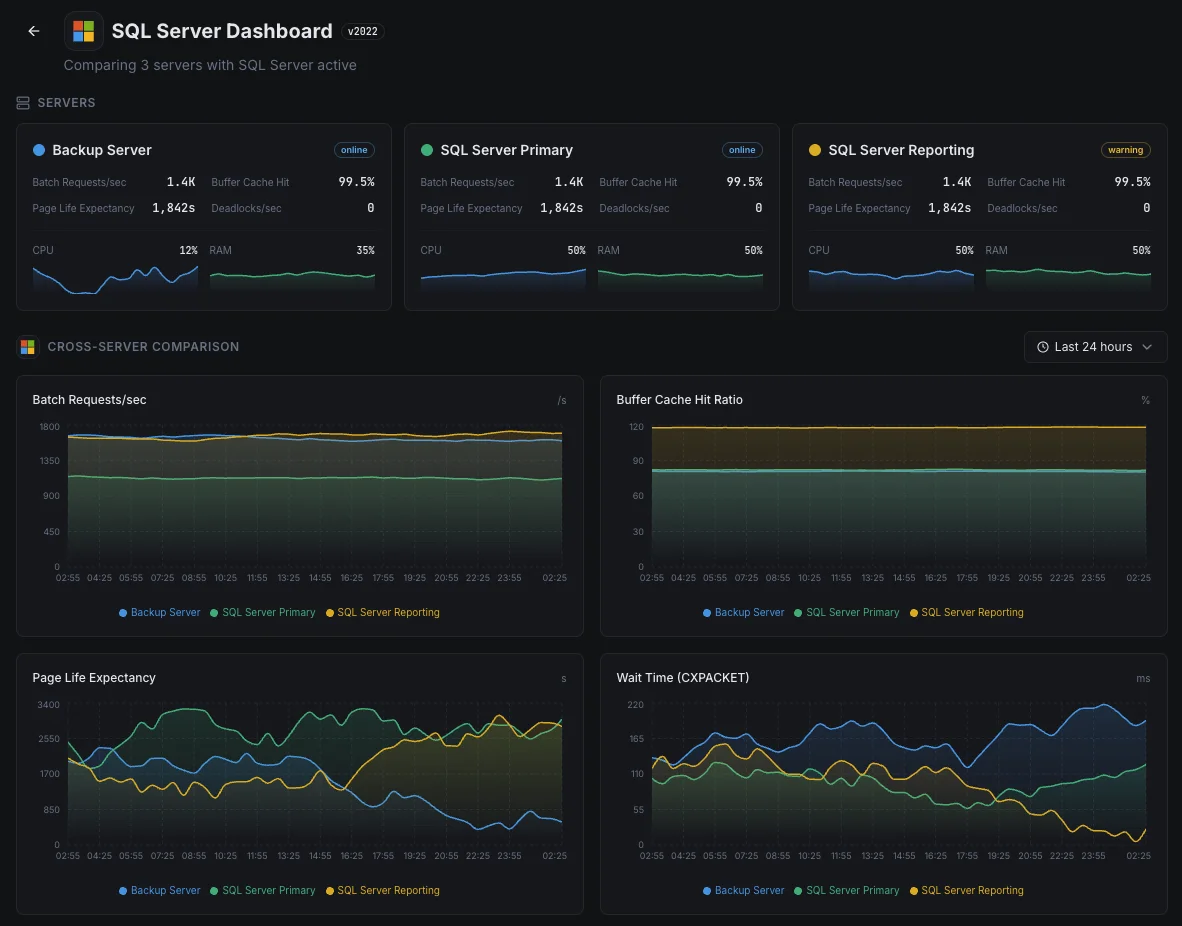
- Unified dashboard for servers, databases, and uptime
- Flexible alerting via Slack, PagerDuty, Telegram & more
- Historical data retention for capacity planning & audits
Common SQL Server monitoring scenarios
Where SQL Server typically runs today — and what could go wrong if no one's watching.
Business apps and ERP systems
When SQL Server runs critical business apps — finance, HR, sales — a slow database becomes a slow company. We watch the signals that show when the database is starting to struggle so the team can fix it before staff start calling IT.
Backup databases for disaster recovery
Companies run extra copies of their database — often in another region — so a single failure doesn't take the business offline. When those copies fall behind, recovery would lose more data than expected. We watch every copy so the disaster-recovery plan still works on the day you actually need it.
SQL Server in the cloud or on Linux
Whether SQL Server runs in Azure, on Linux, or somewhere in between, the visibility you get from the platform alone is rarely enough. We surface query slowdowns and other internal issues so cost and performance both stay in your control.
Prerequisites for MSSQL
Make sure you've got these in place — most installs are a 60-second job once they are.
- Microsoft SQL Server 2016 or later (SQL Server 2022/2025 recommended), Azure SQL MI, or Azure SQL DB
- A SQL login with
CONNECT ANY DATABASE,VIEW SERVER STATE,VIEW ANY DEFINITION, andSELECTgrants - TCP/IP enabled on the instance, with the port reachable from Xitogent
Get started in minutes
Install Xitogent on your Windows server
Download and install the Xitogent agent on your Windows Server hosting SQL Server.
# Download from https://xitoring.com/xitogent
# Run the installer as AdministratorConfigure SQL Server access
Create a dedicated login for monitoring with minimal privileges:
CREATE LOGIN xitoring WITH PASSWORD = 'your_password';
CREATE USER xitoring FOR LOGIN xitoring;
GRANT CONNECT ANY DATABASE TO xitoring;
GRANT VIEW SERVER STATE TO xitoring;
GRANT VIEW ANY DEFINITION TO xitoring;
GRANT SELECT TO xitoring;Enable the MSSQL integration
Use the Xitoring dashboard or CLI to enable the MSSQL integration.
xitogent integrateConfigure alert thresholds (optional)
Set custom thresholds for buffer cache hit ratio, page life expectancy, or deadlock count to get notified when something needs attention.
Verify it's working
Run this command on the server to confirm Xitogent picked up the integration. Fresh metrics will start streaming to your dashboard within ~30 seconds.
sudo xitogent statusConsidering alternatives?
See how Xitoring stacks up against the alternatives for MSSQL monitoring — flat pricing, deeper integrations, and one agent that covers your whole stack.


Frequently asked questions
What is SQL Server monitoring?
How do I monitor SQL Server Page Life Expectancy?
What are SQL Server wait stats and how do I read them?
How do I detect blocking and long-running queries in SQL Server?
How do I monitor Always On Availability Groups?
What is Query Store and how do I use it?
How do I detect deadlocks in SQL Server?
How do I monitor SQL Server backup health?
What SQL Server versions are supported?
Start monitoring MSSQL today
Set up in under 60 seconds. No credit card required. Full metrics from day one.
Start Free TrialKeep exploring