
Netstat Monitoring
Monitor TCP connection state distribution (ESTABLISHED, TIME_WAIT, CLOSE_WAIT), listening ports, interface RX/TX errors and drops, retransmits, conntrack table utilization, and unauthorized port-open events in real time.
Why monitor Netstat?
Network connection monitoring catches three things at once: security (unauthorized listening ports, unusual outbound traffic), capacity (conntrack table exhaustion silently drops packets on NAT/firewall hosts), and troubleshooting (CLOSE_WAIT leaks, TIME_WAIT exhaustion, retransmit spikes). All three correlate with 'sometimes slow' user reports that are hard to root-cause without the data.
Network connection monitoring, explained
Netstat-style monitoring tracks every active TCP/UDP connection on the host plus listening ports, interface statistics, and kernel-level network counters — used for security (unexpected listening ports = potential compromise; unusual outbound connections = data exfiltration risk), capacity planning (conntrack table exhaustion silently drops packets in NAT/firewall scenarios), and troubleshooting (CLOSE_WAIT leaks where apps forget to close sockets, TIME_WAIT exhaustion on busy proxies, retransmit spikes signaling network degradation). Xitoring auto-discovers your host's network state, reads from /proc/net + /proc/sys/net (or PowerShell Get-NetTCPConnection on Windows), and routes alerts to Slack, PagerDuty, Telegram, or your existing on-call.
What we monitor
TCP States Distribution
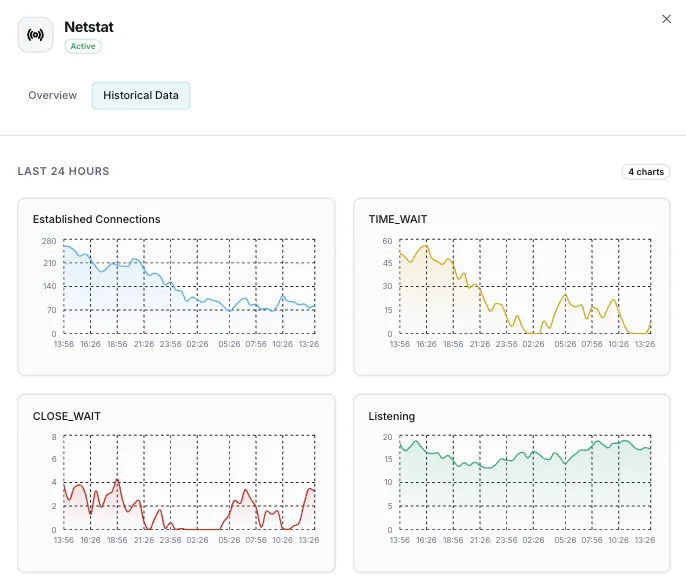
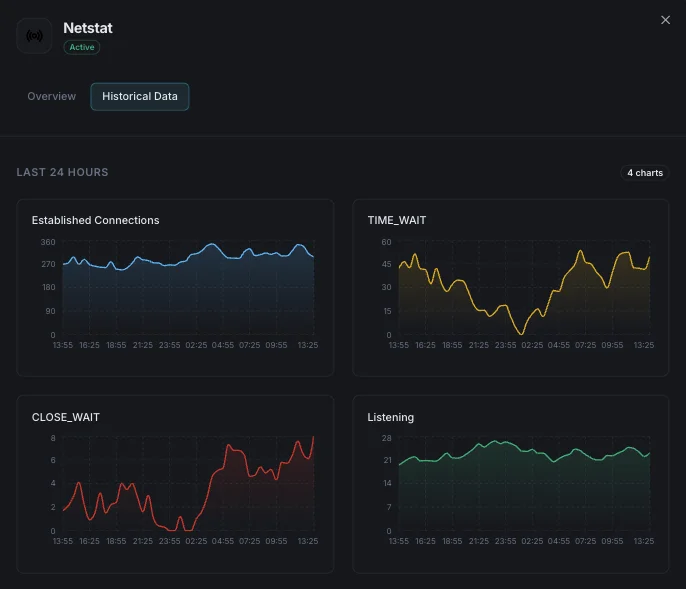
Per-state counts: ESTABLISHED (active), TIME_WAIT (closed, waiting for stragglers), CLOSE_WAIT (peer closed, local app hasn't), SYN_SENT/RECV (handshaking), FIN_WAIT_1/2 (closing), LAST_ACK, CLOSING. The shape of this distribution diagnoses most TCP-layer problems.
Listening Ports
All ports currently accepting connections (TCP and UDP, IPv4 and IPv6), with process name and PID. Unexpected ports = potential compromise; missing expected ports = service down.
Active Connections (ESTABLISHED)
Currently-established TCP connections — your real concurrent-request count. Spikes flag traffic surges; sustained drops with stable listener flag accept-queue overflow.
TIME_WAIT Count
Connections in the 2×MSL closed-wait state (~60s on Linux). High values on busy outbound proxies indicate ephemeral port exhaustion is approaching — tune `tcp_tw_reuse` and `ip_local_port_range`.
CLOSE_WAIT Count
Connections where the peer sent FIN but the local app hasn't called `close`. Sustained CLOSE_WAIT growth = app-level FD leak. Find offenders via process attribution.
Interface RX / TX Bytes
Per-NIC throughput from `/proc/net/dev`. Approaching NIC line rate = saturation; track to plan bonding/upgrades.
Interface Errors / Drops
RX/TX errors (CRC, frame errors) and dropped packets per interface. Non-zero error rate = cable, NIC, or switch hardware issue; non-zero drop rate often signals overflow buffers.
TCP Retransmits
From `/proc/net/snmp` — TCP segments retransmitted. Spike rates flag network instability (lossy WAN link, congested LAN); pair with peer-side metrics for root cause.
Accept-Queue Overflow
`ListenOverflows` from `/proc/net/netstat` — kernel dropped a SYN because the app's accept backlog was full. Almost always means tune `net.core.somaxconn` AND raise app-side `listen` backlog parameter.
Conntrack Table Utilization
`nf_conntrack_count` vs `nf_conntrack_max`. NAT and firewall hosts (including Kubernetes nodes) silently drop packets when the table is full — alert above 80% to leave headroom.
Routing Table
Kernel IP routing entries from `/proc/net/route`. Unexpected default-gateway changes or new routes can indicate misconfiguration, container networking issues, or compromise.
Per-Process Outbound Connections
Outbound connections grouped by process name/PID — useful for spotting unexpected egress (e.g., a web server suddenly talking to an external IP it shouldn't).
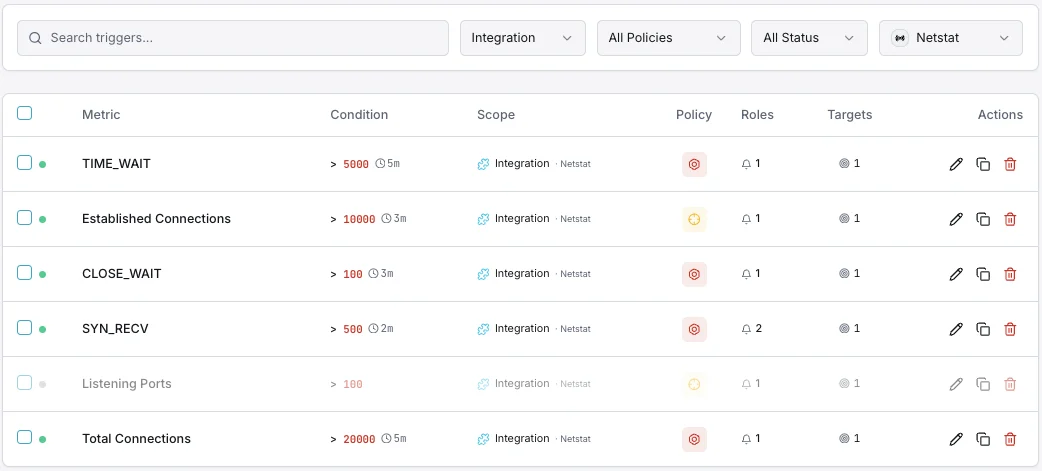
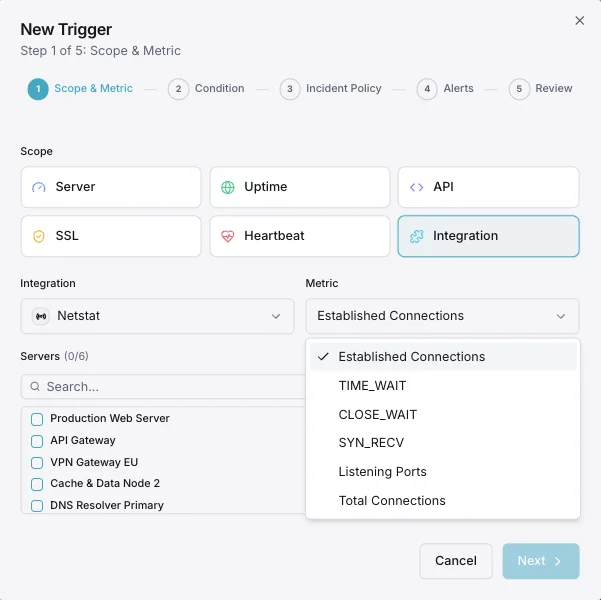
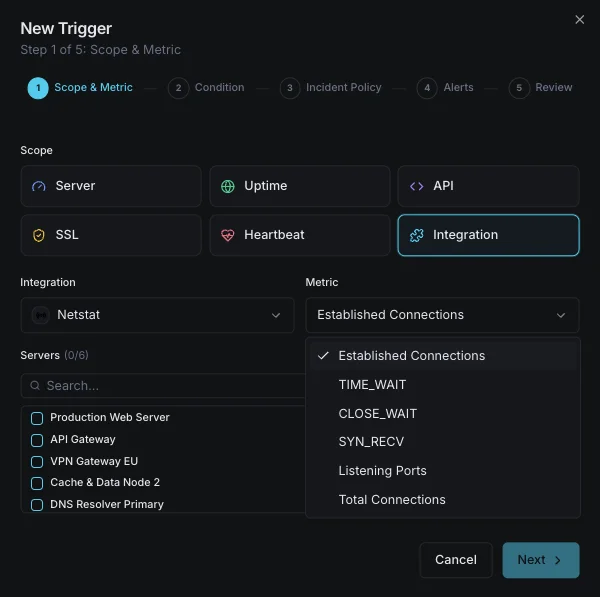
Configurable alert triggers
Set up custom triggers in your dashboard to get notified the moment Netstat metrics cross your defined thresholds.
Unauthorized Port
criticalFires when an unexpected port is detected listening.
Connection Spike
warningAlerts on sudden increase in active connections.
Firewall Change
criticalTriggers when firewall rules are modified.
Interface Errors
warningFires on network interface error rate increase.
Importance of Netstat Monitoring
Network visibility is critical for security and performance. Monitoring active connections, open ports, and routing helps you detect unauthorized access, identify bottlenecks, and ensure your firewall rules are intact.
- Detect unauthorized open ports instantly
- Identify suspicious network connections
- Monitor firewall rule changes in real time
- Track network interface health and errors
Why Choose Xitoring
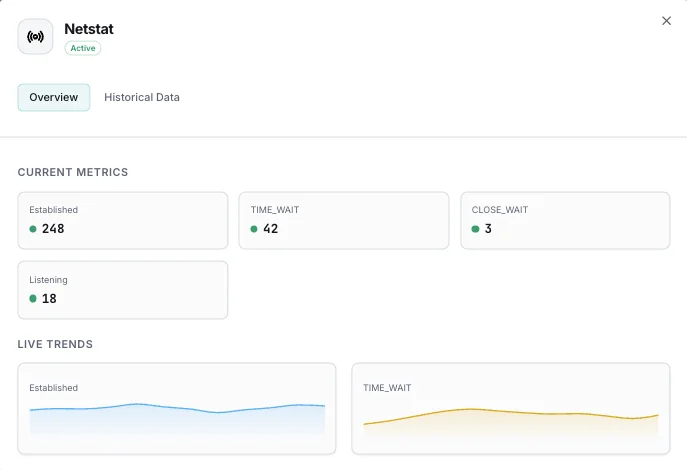
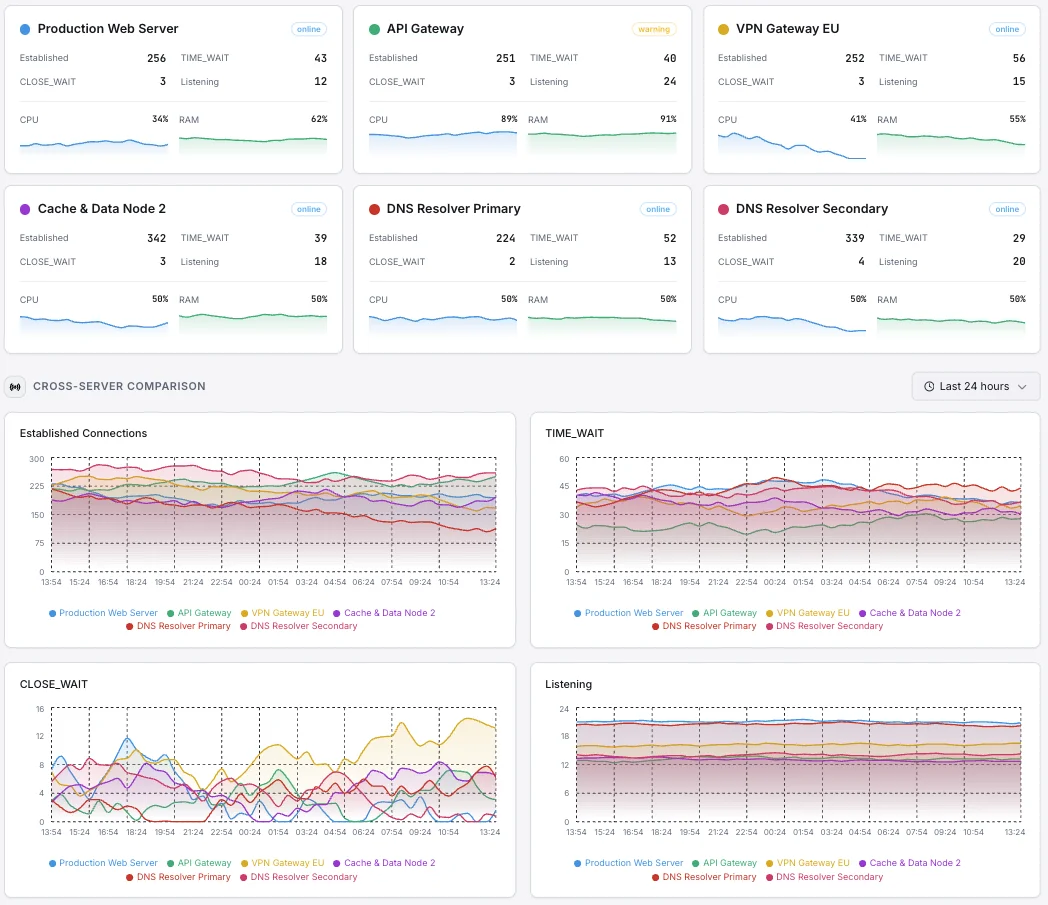
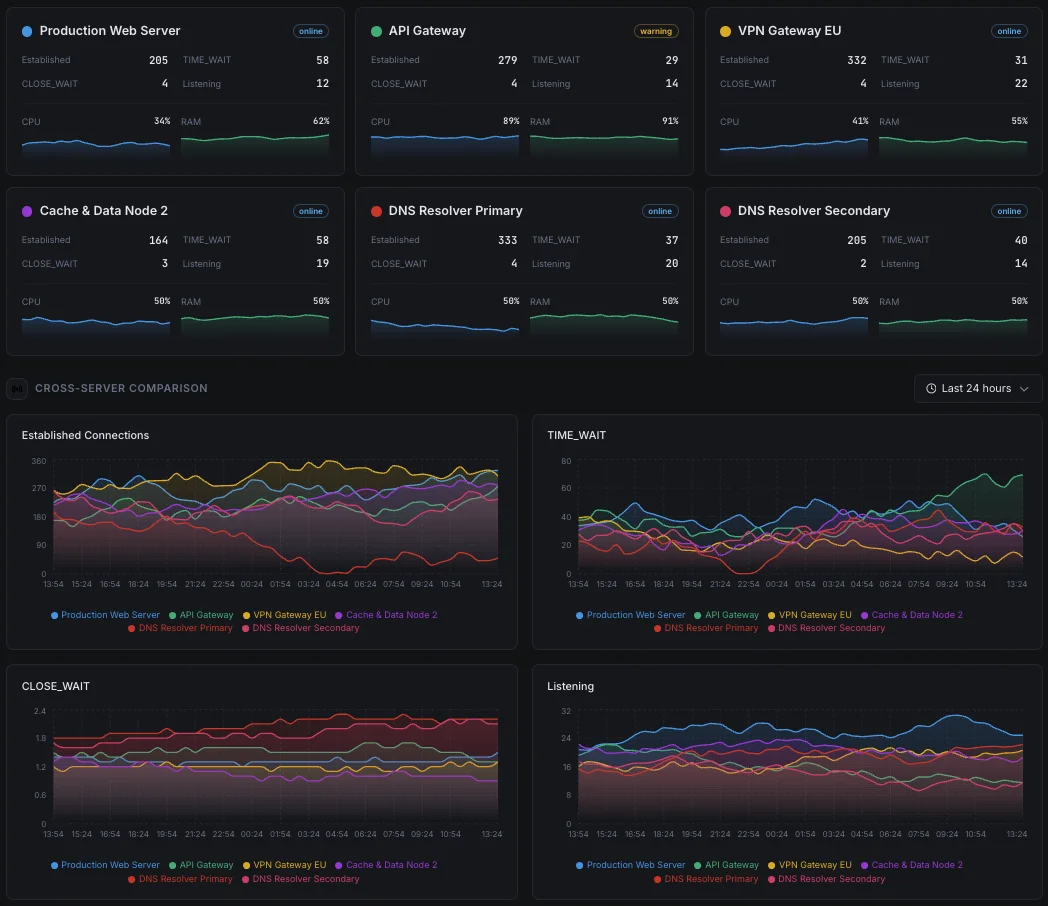
Xitoring provides effortless Netstat monitoring with zero dependencies. The agent reads network statistics directly from the OS — no netstat CLI installation required. Get historical trends, real-time alerts, and full visibility into your network stack.
- Zero-dependency setup
- Historical network data & trends
- Unified dashboard for all servers
- Multi-channel alerting on anomalies
Common network connection monitoring scenarios
Where this kind of monitoring most often catches issues before they spread.
Catching unauthorized activity on your servers
A compromised server often gives itself away by opening unexpected network connections — to an attacker's machine, or to places it has no business talking to. We flag the moment your server starts behaving like that, so a break-in is caught while it's still contained.
Avoiding silent network bottlenecks
Busy servers can quietly hit invisible network limits that cause traffic to be dropped — with no obvious error in the app. We watch those limits so they're raised in advance, instead of being discovered during an outage.
Tracking down "the network feels slow"
When users complain that things are "sometimes slow", the cause is often the network itself — dropped packets, leaking connections, retries. We surface the patterns so the team can pinpoint the real cause in minutes instead of chasing ghosts for hours.
Prerequisites for Netstat
Make sure you've got these in place — most installs are a 60-second job once they are.
- Linux or Windows server (no extra packages required; works without
netstatCLI being installed) - sudo / Administrator access to install Xitogent
- OS-level network counters available — true on every supported OS by default
Get started in minutes
Install Xitogent
Install the Xitoring agent on your Linux or Windows server.
curl -s https://xitoring.com/install.sh | sudo bash -s -- --key=YOUR_API_KEYEnable Netstat integration
Run the integrate command and select Netstat. Xitogent reads statistics directly from the operating system — the netstat CLI is not required to be installed.
xitogent integrateVerify it's working
Run this command on the server to confirm Xitogent picked up the integration. Fresh metrics will start streaming to your dashboard within ~30 seconds.
sudo xitogent statusConsidering alternatives?
See how Xitoring stacks up against the alternatives for Netstat monitoring — flat pricing, deeper integrations, and one agent that covers your whole stack.



Frequently asked questions
What is netstat monitoring?
How do I see active network connections on Linux?
What does TIME_WAIT mean in netstat?
What causes high CLOSE_WAIT connections?
ss vs netstat — which should I use?
How do I monitor network interface errors and drops?
What is conntrack table exhaustion and how do I fix it?
How do I detect listening ports I didn't expect?
How do I monitor outbound connections per process?
Start monitoring Netstat today
Set up in under 60 seconds. No credit card required. Full metrics from day one.
Start Free Trial