Varnish Monitoring
Monitor Varnish `MAIN.cache_hit` ratio, backend health, `MAIN.thread_queue_len`, `MAIN.n_lru_nuked` evictions, session drops, and storage headroom in real time — agent-based via `varnishstat`.
Why monitor Varnish?
Varnish accelerates HTTP by orders of magnitude — but when cache hit ratios drop, backends fail, or threads exhaust, a Varnish issue becomes a site-wide outage. Because Varnish sits between users and your origin tier, monitoring it well means catching most cache-layer incidents in their first minute.
Varnish monitoring, explained
Varnish monitoring catches cache hit-ratio drops, backend health failures, and thread-pool exhaustion before they turn into user-visible latency or outages. Since Varnish typically sits in front of WordPress, Magento, or your origin tier, a Varnish issue is usually a site-wide issue — monitoring it well means catching most cache-layer incidents in their first minute. Xitoring auto-discovers your Varnish, reads from varnishstat, and routes alerts to Slack, PagerDuty, Telegram, or your existing on-call.
What we monitor
Cache Hit Ratio (MAIN.cache_hit / cache_miss)
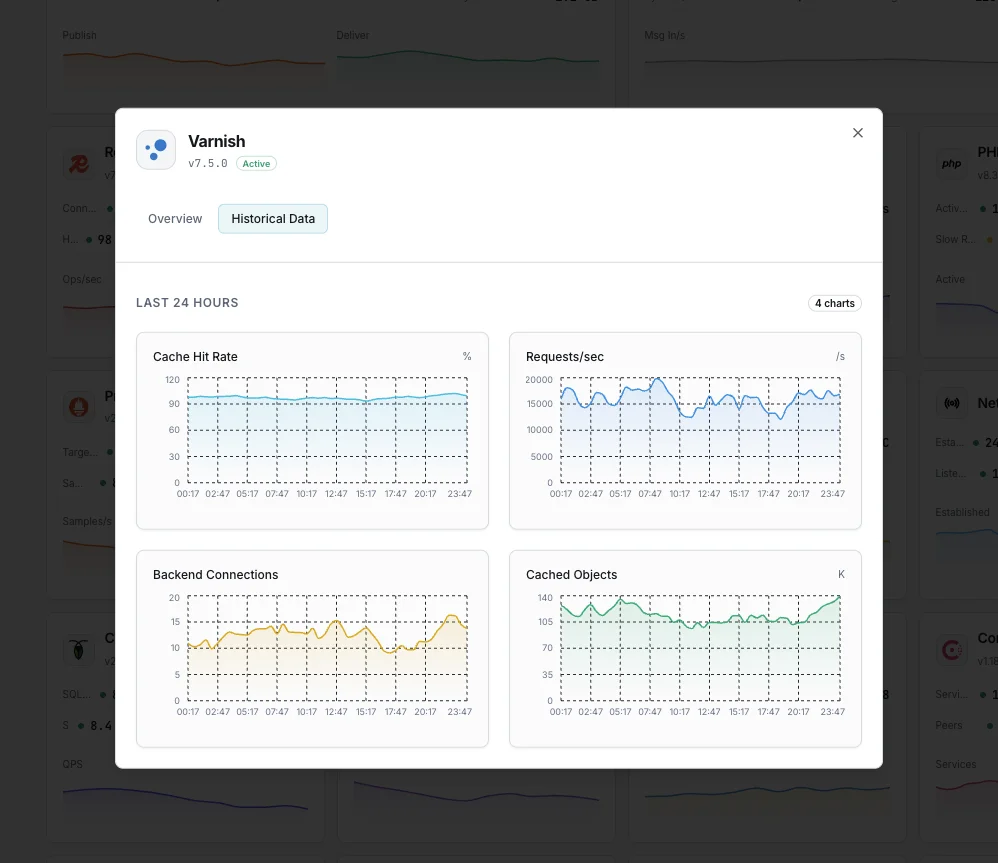
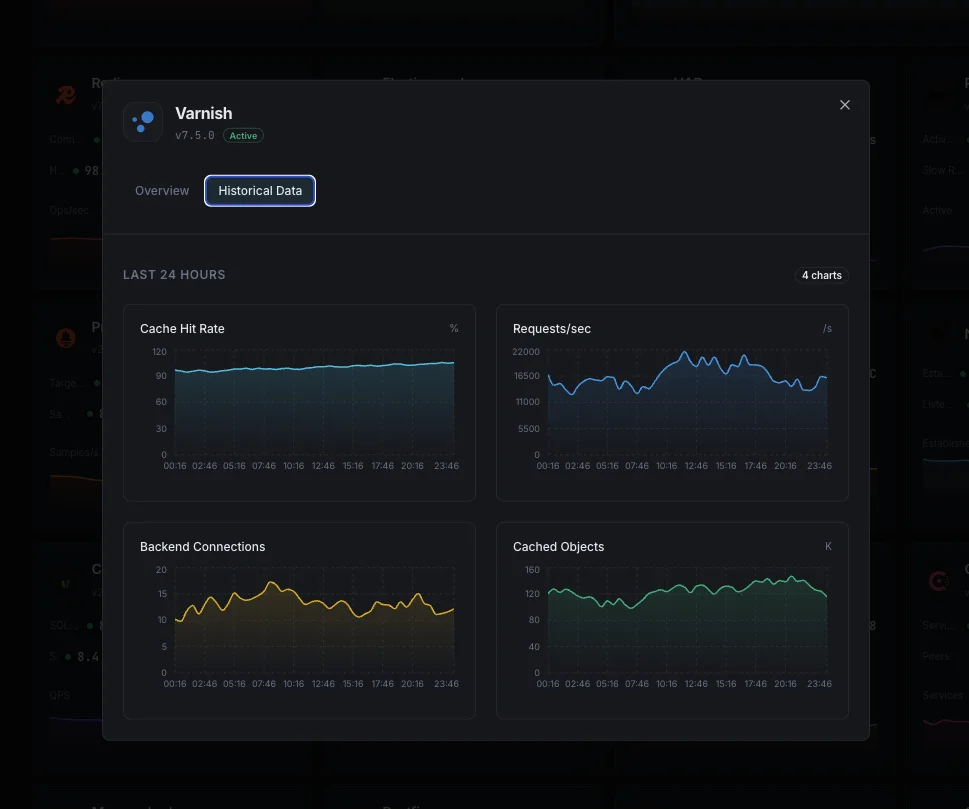
Percentage of requests served from cache. The headline ranking signal — well-tuned WordPress + Varnish setups sit at 90%+.
MAIN.client_req
Total client-facing requests handled by Varnish (rate-derived per second). Compare with `MAIN.backend_req` to see how much traffic the cache absorbs.
MAIN.backend_req / backend_conn
Requests forwarded to origin and connections opened. Spikes here mean cache invalidation storms, low hit ratio, or backend warming after restart.
MAIN.backend_unhealthy
Backends marked sick by probe directors. Any non-zero value during normal traffic is a hard signal — origin is failing health checks.
MAIN.thread_queue_len
Requests waiting for a free worker thread. Sustained non-zero values mean the thread pool is exhausted — bump `thread_pool_max` or split into more pools.
MAIN.threads / threads_failed
Total worker threads vs failed thread creations. Failed threads indicate hitting OS or `thread_pools` limits — Varnish drops connections when threads can't be created.
MAIN.sess_conn / sess_dropped
Total sessions accepted vs dropped (queue full). Any non-zero `sess_dropped` rate is a thread-pool capacity alert.
MAIN.n_lru_nuked
Objects evicted from cache to make room for new ones. High values mean your `-s` storage is undersized for the working set — leading indicator of falling hit ratio.
MAIN.n_object
Objects currently in cache. Tracks against `n_objectcore`/`n_objecthead` for cache-tuning insight on object overhead.
SMA.s0.g_bytes / g_space
Storage in use vs available for the default storage backend. When `g_bytes / (g_bytes + g_space)` approaches 100%, Varnish starts evicting.
MAIN.s_pipe / s_pass
Requests piped (TCP tunnel) vs passed (origin-direct, no caching). High `s_pass` rates often surface VCL `return(pass)` rules that should be `return(hash)`.
Ban List Length
Active VCL bans not yet evicted. A growing ban list slows cache lookups — should converge to near zero as the ban-lurker thread evicts banned objects.
Configurable alert triggers
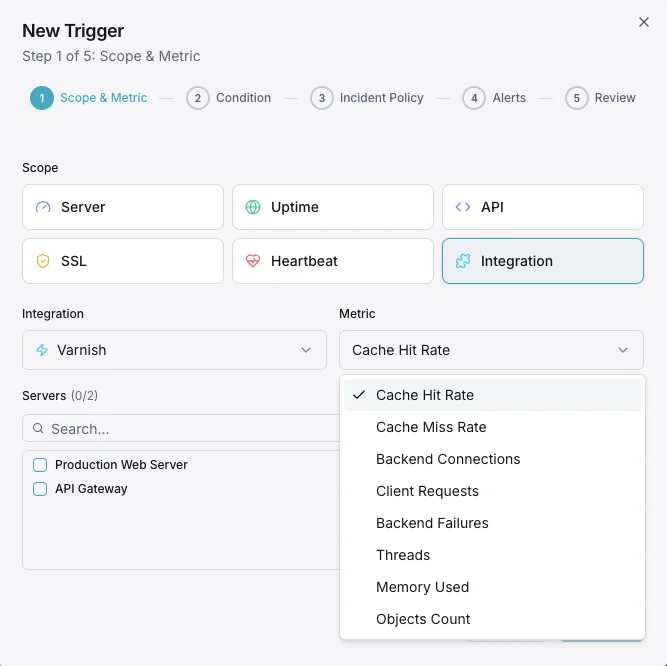
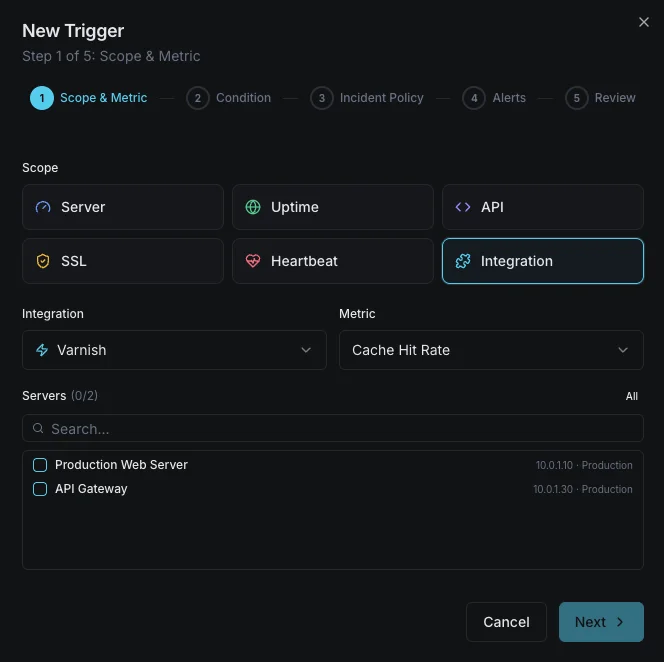
Set up custom triggers in your dashboard to get notified the moment Varnish metrics cross your defined thresholds.
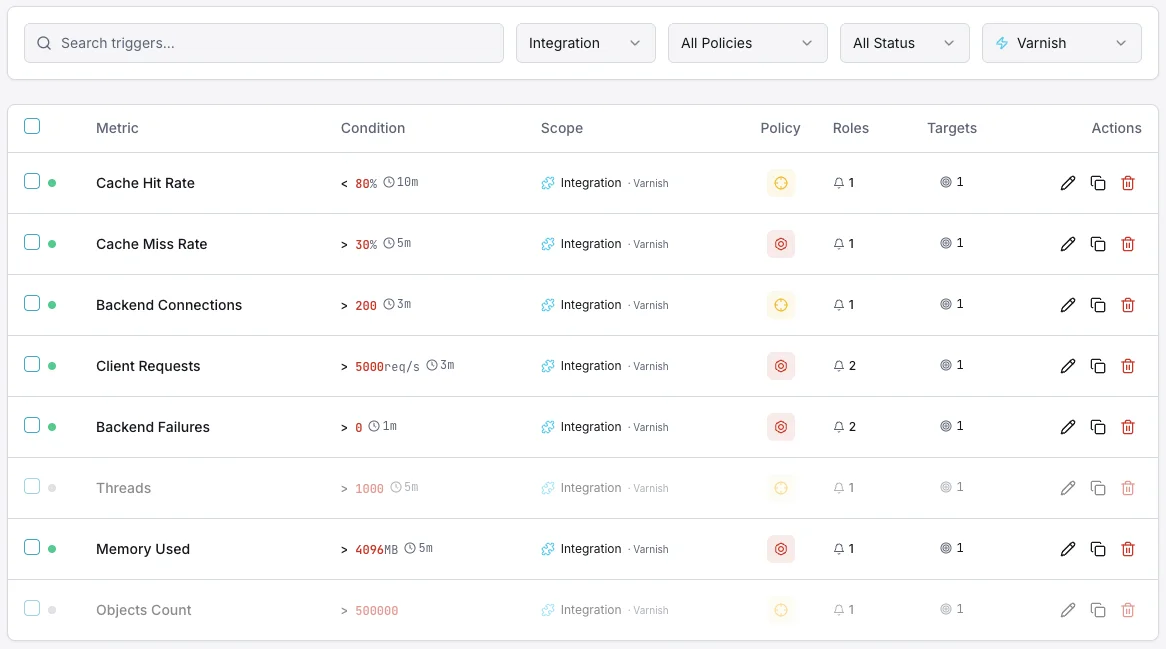
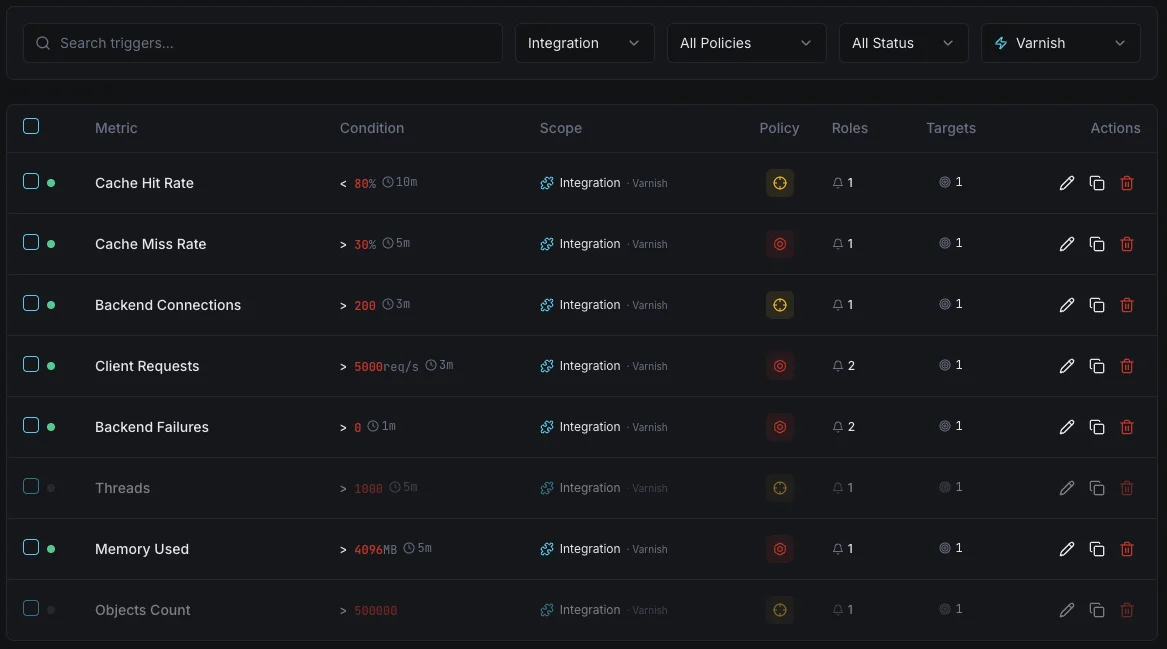
Cache Hit Ratio
warningFires when hit ratio drops below threshold.
Backend Down
criticalAlerts when a backend server fails health checks.
Object Evictions
warningTriggers on high eviction rate indicating cache pressure.
Thread Pool
criticalFires when thread pool is exhausted.
Request Rate
warningAlerts on unusual request throughput.
Importance of Varnish Monitoring
Varnish Cache can serve content 300x faster than origin servers. Without monitoring, cache misses and backend failures negate these benefits.
- Maintain high cache hit ratios for optimal speed
- Detect backend failures immediately
- Track evictions to right-size cache storage
- Monitor thread pools to prevent request drops
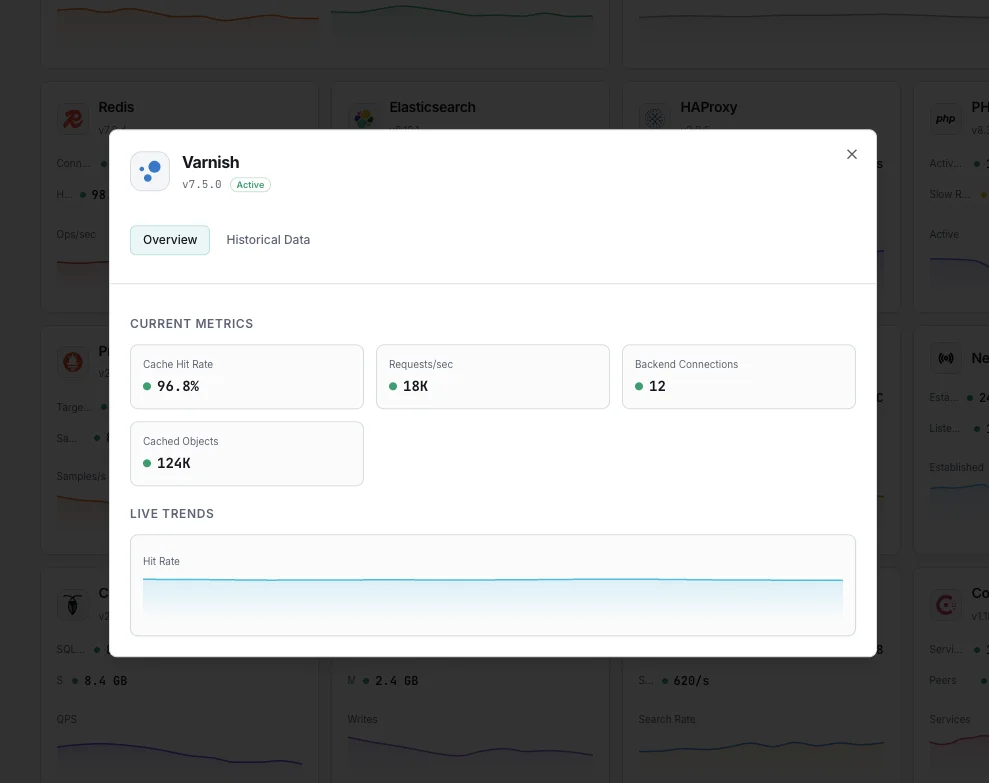
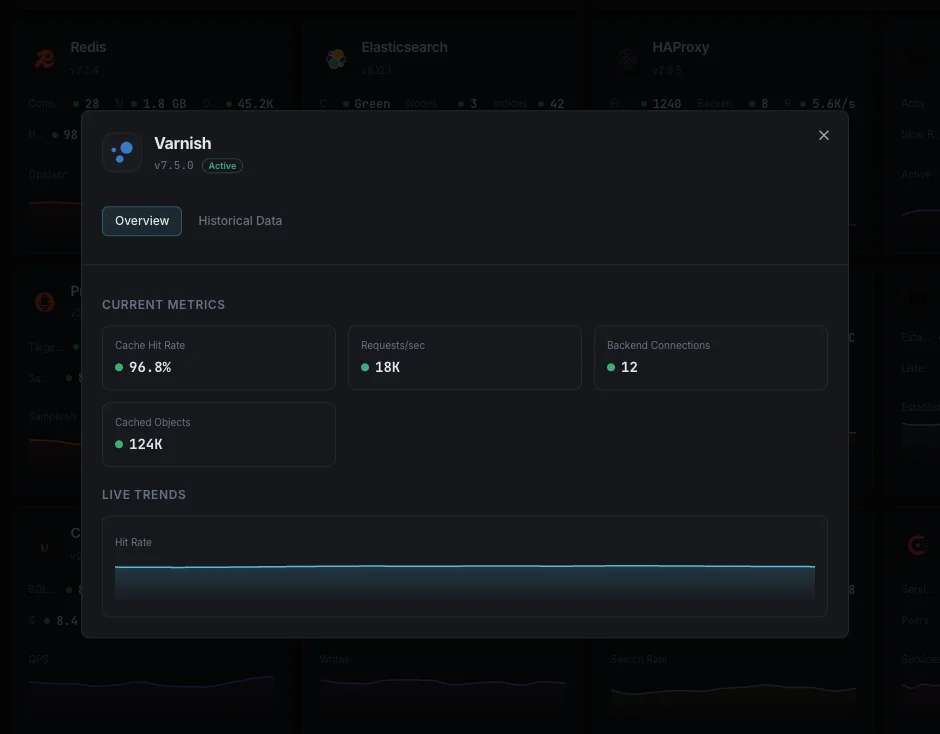
Why Choose Xitoring
Enterprise-grade Varnish monitoring with zero-config setup.
- One-command install
- 15+ global monitoring nodes
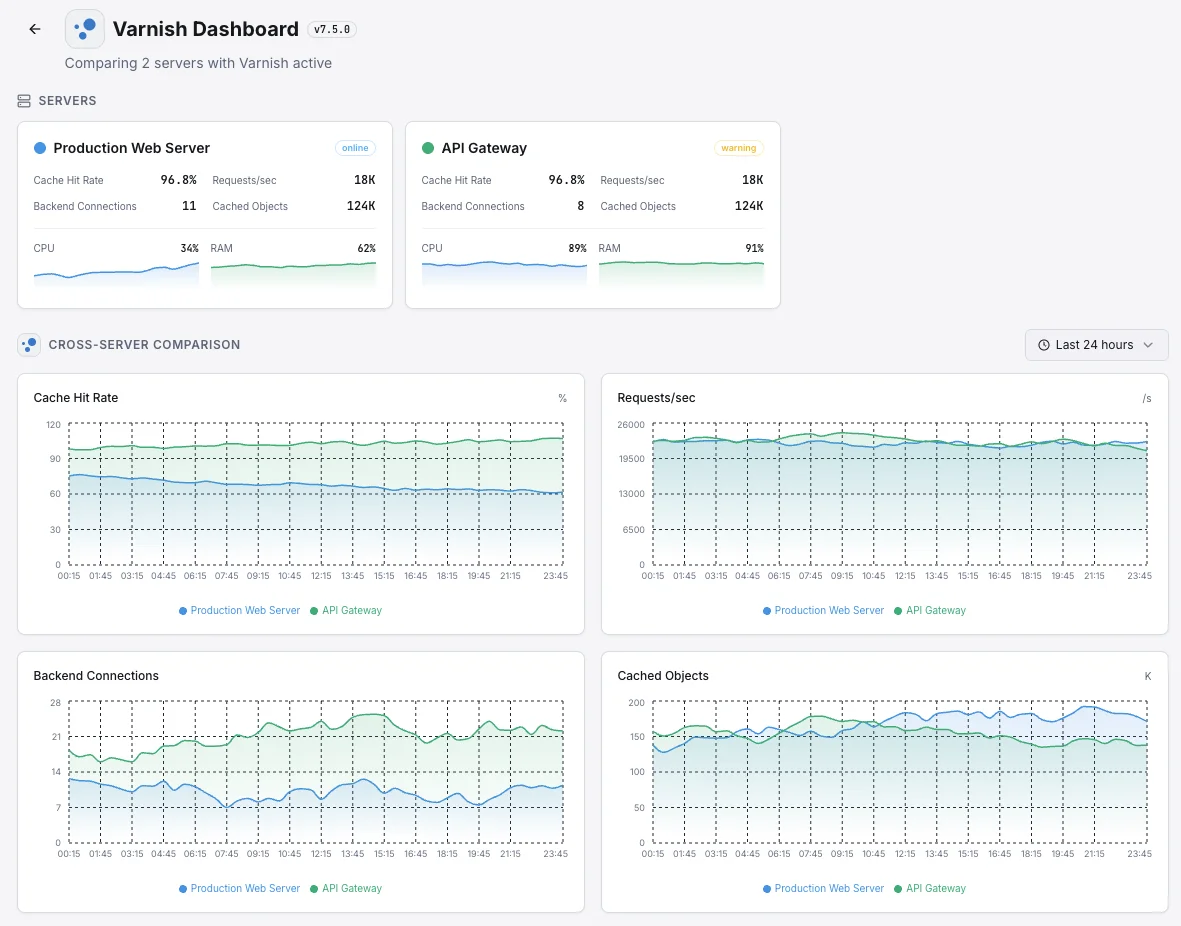
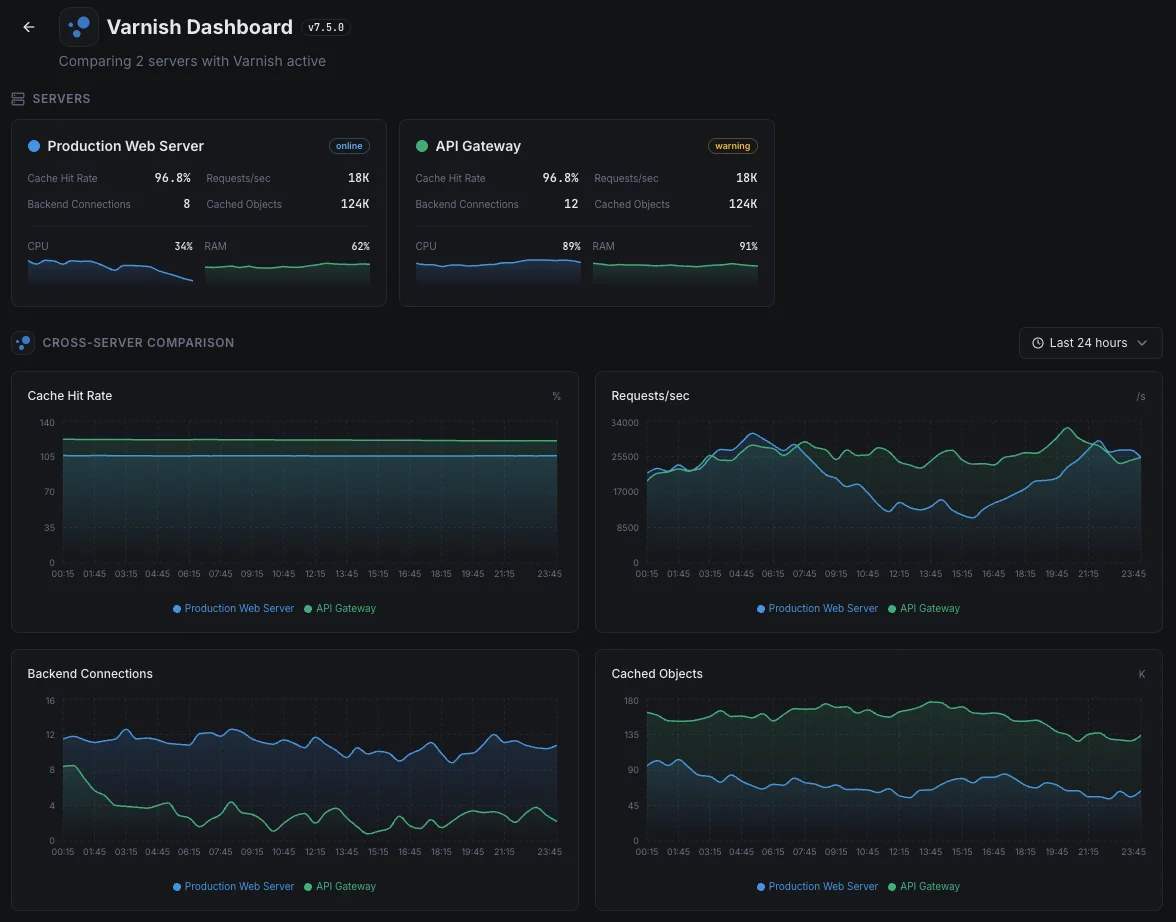
- Unified dashboard
- Multi-channel alerting
- Historical data retention
Common Varnish monitoring scenarios
Where Varnish typically runs today — and what could go wrong if no one's watching.
Speeding up WordPress and content sites
Varnish keeps content sites loading nearly instantly by remembering finished pages. When that effect stops working, the site quietly gets slow and search rankings begin to slip. We catch the dip the moment it begins so traffic and SEO aren't quietly hurt.
Online stores at checkout
Online stores need to stay fast during the exact moments customers are buying — even when traffic spikes. We watch the signals that show whether the store can absorb a rush, so promotions and sales don't turn into lost revenue.
Caching for APIs and microservices
When Varnish caches results for an internal API, it keeps the underlying apps from being overwhelmed by repeated requests. We watch for the moment it starts struggling under burst load so capacity can be raised before the apps behind it start failing.
Prerequisites for Varnish
Make sure you've got these in place — most installs are a 60-second job once they are.
- Varnish Cache 6.x or 7.x (Varnish Enterprise also supported)
varnishstatbinary available on the system PATH- Read access to the Varnish shared memory log (typically
/var/lib/varnish— granted by default for root)
Get started in minutes
Install Xitogent on your Varnish host
Install the lightweight Xitogent monitoring agent on the host running Varnish Cache. Xitogent runs as root, so it can read Varnish's shared memory directly with no extra group membership.
curl -s https://xitoring.com/install.sh | sudo bash -s -- --key=YOUR_API_KEYVerify varnishstat is available
Confirm the `varnishstat` binary is on PATH and returns counters. Run `varnishstat -1` on the host — you should see a snapshot of cache, backend, and session metrics.
varnishstat -1Enable the Varnish integration
Run `sudo xitogent integrate` and select Varnish. Xitogent will test the connection and auto-detect your Varnish instance and configured backends — the rest is set up automatically.
sudo xitogent integrateConfigure alert thresholds (optional)
Set custom thresholds for Cache Hit Ratio, Backend Down events, or Object Evictions to catch cache regressions and capacity issues before users see uncached responses.
Verify it's working
Run this command on the server to confirm Xitogent picked up the integration. Fresh metrics will start streaming to your dashboard within ~30 seconds.
sudo xitogent statusConsidering alternatives?
See how Xitoring stacks up against the alternatives for Varnish monitoring — flat pricing, deeper integrations, and one agent that covers your whole stack.



Frequently asked questions
What is Varnish monitoring?
How do I check Varnish cache hit ratio?
How do I monitor Varnish backend health?
What does n_lru_nuked mean?
How do I monitor Varnish thread pool exhaustion?
Can I integrate Varnish with Prometheus and Grafana?
Varnish Cache vs Varnish Enterprise — what's monitored differently?
Will the integration affect Varnish performance?
Can I monitor multiple Varnish instances on one server?
Start monitoring Varnish today
Set up in under 60 seconds. No credit card required. Full metrics from day one.
Start Free Trial