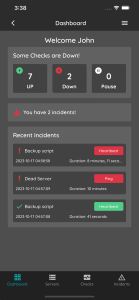
Xitoring introduces heartbeat monitoring

Hello,

Heartbeat monitoring is finally here!

At Xitoring, we know how important it is to ensure that your services and applications are running smoothly. That’s why we’re excited to introduce our latest feature: the Heartbeat Check.

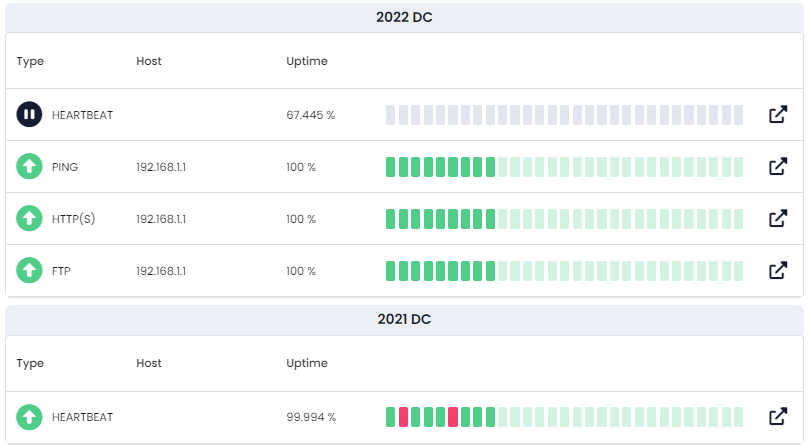
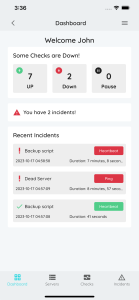
So, what is a Heartbeat Check? Simply put, it’s a signal sent by your service or application at regular intervals to Xitoring. Our system then checks whether it has received the heartbeat within a certain time frame. If it hasn’t, we assume that the service or application is not responding correctly and triggering an incident.

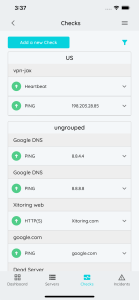
Setting up a Heartbeat Check is easy. Just select a label like you would for any other check, configure the proper trigger and notification roles, and set the fault tolerance (the maximum interval between heartbeats) to your desired time frame. After creating the check, you’ll receive a unique link that you can use to define your heartbeat. Adding a simple GET request to your script or code can ensure that your service or application is running smoothly.

Using a Heartbeat Check is also a great way to perform an overall availability check for your Linux machine. By adding the GET request command to your crontab, you can ensure that your machine is up and running every minute.

Heartbeat monitoring use cases:

In addition to providing overall availability checks for your Linux machine, Xitoring’s Heartbeat Check has a variety of use cases to ensure that your services and applications are running smoothly.

  • One use case is ensuring that your backup script is running. By adding a GET request to your backup script, Xitoring can monitor its activity and ensure it’s working properly.
  • Another use case is ensuring that your cronjobs are running. By adding a GET request to your crontab, Xitoring can ensure that your scheduled tasks are being executed on time.
  • Xitoring’s Heartbeat Check can also monitor your application queue, ensuring that it’s working as expected. By adding a GET request to your queue processing script, Xitoring can alert you if any issues arise with your queue.
  • For Laravel users, Xitoring offers Laravel queue heartbeat monitoring. This feature allows you to monitor the health of your Laravel queue worker and ensure that it’s processing your jobs as expected.

Don’t let service disruptions catch you off guard. With Xitoring’s Heartbeat Check, you can rest easy knowing that your services and applications are always being monitored. Try it out today and see the difference it can make!

You can read more about heartbeat monitoring, and some code snippets of Bash script and Python on our docs.

Get recurring Email reports for your Uptime!

Hello,

We have just deployed a new version including the “Recurring Email Report” feature that lets you create multiple email reports for your uptime checks or servers, with your desired period (Daily, Weekly, Monthly) and your main email or teammates!

The free plan is limited to one report, Paid users can create as many as reports they want!

Email report sends out schedule:

  • Daily Reports: you get an email report every day at 10 AM UTC.
  • Weekly Reports: you get an email report every week on Monday at 10 AM UTC.
  • Monthly Reports: you get an email report every 1st of the month at 10 AM UTC.

(more…)

Rhel 9 is completely supported on Xitogent

We are happy to announce that Xitogent is now compatible with Redhat 9 distros.  Xitoring offers free server monitoring (up to 5 servers) for Centos 9 / Redhat 9 / CloudLinux 9 / Almalinux 9 / Rockylinux 9 users.

By Installing Xitogent on your Redhat 9 distro server you can easily gather all server statistics and data without hassle, and Xitoring does the most for you, including service discovery, creating initial checks, generating graphs, configuring initial triggers, etc.

Xitogent runs as a service on your server and automatically sends your server statistics continuously to your nearest Xitoring Server and we use the data to generate graphs or find out if something’s wrong on your server (e.g. we’ll automatically notify you if your CPU or memory usage is above normal). It runs on a recurring interval and sends statistics to the nearest probe node, we’ll use the data to make sure everything is fine on your server and then use it to make useful graphs (Server Load, CPU Usage, Memory Usage, Disk IO, and Disk Usage).

If you’re new to Xitoring, you can register in a minute and start monitoring 5 Linux servers at no cost forever!


About Xitogent

The Xitogent runs as a service on your server and automatically sends your server statistics continuously to your nearest Xitoring Server and we use the data to generate graphs or find out if something’s wrong on your server (e.g. we’ll automatically notify you if CPU or memory usage is above normal).

What is uptime monitoring and why is it important?

What is uptime monitoring?

Uptime monitoring is the practice of regularly checking the availability and performance of a website, server, or application to ensure that it is accessible to users and performing as expected. This is typically done using automated tools that perform checks at set intervals, such as every minute or every five minutes. The purpose of uptime monitoring is to minimize downtime, improve website performance, ensure compliance, enhance security, and support business continuity.

Why is uptime monitoring important?

Uptime monitoring is critical for businesses and organizations that rely on their websites and applications to generate revenue, provide customer support, or deliver other essential services. Here are some key reasons why uptime monitoring is important:

  1. Minimizes downtime: Downtime can be costly for businesses, as it can lead to lost revenue, decreased customer satisfaction, and damage to brand reputation. Uptime monitoring can help minimize downtime by alerting teams to issues as soon as they arise, allowing them to quickly diagnose and resolve the problem.
  2. Improves website performance: Uptime monitoring tools can also provide insights into website performance, such as page load times and server response times. This information can be used to identify bottlenecks and other issues that may be impacting website performance, allowing teams to optimize their websites for better user experience.
  3. Ensures compliance: Some businesses and organizations are required to meet certain uptime requirements or service level agreements (SLAs) as part of regulatory compliance or contractual obligations. Uptime monitoring can help ensure that these requirements are being met and provide documentation to support compliance efforts.
  4. Enhances security: Uptime monitoring can also help detect and prevent security threats, such as DDoS attacks or malware infections. By monitoring server logs and other security indicators, teams can quickly identify and respond to security incidents, protecting their websites and applications from harm.
  5. Supports business continuity: Uptime monitoring is an important part of business continuity planning. By ensuring website availability and performance, organizations can minimize the impact of service disruptions on their business operations. This is especially important for businesses that rely heavily on their websites or applications to generate revenue or provide customer support.

In summary, uptime monitoring is an essential practice for businesses and organizations that rely on their websites and applications to generate revenue, provide customer support, or deliver other essential services. By ensuring website availability and performance, uptime monitoring can help minimize downtime, improve website performance, ensure compliance, and enhance security.


How much does it cost to monitor uptime?

The cost of monitoring server uptime can vary depending on the specific tools and services used. There are both free and paid options available, and the cost can range from a few dollars per month to thousands of dollars per year.

For example, basic server monitoring services that simply check if the server is up and running can be found for free, while more advanced services that offer real-time performance monitoring, alerting, and reporting can cost hundreds of dollars per month.


Xitoring offers 20 uptime checks forever at no cost, you can register on app.xitoring.com and set up your account right now!


No more unnecessary investigations, Scheduled maintenances is here!

Hello,

We are thrilled to announce the new feature on Xitoring, that lets you create “Maintenance Schedules” for your uptime checks and servers in order to avoid false positive alerts or inaccurate reporting of downtime during a maintenance window. The feature is available for free and paid users without any limitations. Selected monitoring Checks or Servers will be paused during the maintenance window, also the status will be reflected on your Public Status Page automatically to inform your users.


Is it necessary to pause monitoring during maintenance?

It depends on the type of maintenance being performed and the specific requirements of the organization. In some cases, it may be necessary to pause uptime monitoring during maintenance to avoid false positives or inaccurate reporting of downtime.

For example, if the maintenance activity involves taking the system or service offline or making changes to critical components, uptime monitoring may need to be paused until the maintenance is completed. Otherwise, the monitoring system may generate false alerts or report false downtime, which could lead to confusion and unnecessary investigations.

On the other hand, if the maintenance activity is not expected to impact the uptime of the system or service, uptime monitoring may not need to be paused. In fact, continuing to monitor uptime during maintenance can help identify any unexpected issues that may arise during the maintenance activity.

Ultimately, the decision to pause uptime monitoring during maintenance should be based on an assessment of the potential impact of the maintenance on system uptime, as well as the specific requirements and objectives of the organization. It is important to communicate any changes in monitoring to relevant stakeholders to ensure clear expectations are set.


If you need help creating your first maintenance you can read more on Docs or contact support@xitoring.com anytime!

Thanks.


How a public status page help your business?

What’s a public status page?

A public status page often offers a summary of the service’s current status, including information such as whether the service is currently up or down, as well as any known faults or events. A timeline of recent events, such as when an issue was originally reported, when it was resolved, and what efforts were made to remedy it, may also be included. Some public status pages also offer information about other connected services and their current state, as well as contact information for the company’s support team. Some service providers host their status pages with third-party solutions, allowing them to integrate the status page into their own website and deliver real-time updates, notifications, and historical data to their clients.

Aside from offering transparency to consumers, a public status page may also be a vital internal tool for a company’s IT staff, giving them a consolidated view of all occurrences and allowing them to respond to and handle any issues that may develop.

How public status page helps your business?

Public status pages can help businesses in several ways:

  1. Transparency: Public status pages provide real-time information to customers about the status of a service, which helps to build trust and credibility with customers by showing that the company is transparent about any issues that may be affecting the service.
  2. Communication: Public status pages can be used as an effective communication tool for businesses to inform their customers about any issues or outages that may be affecting the service, and to keep them updated on the progress of resolving those issues.
  3. Reputation management: By providing real-time information about service disruptions, public status pages can help businesses to minimize the impact of incidents on their reputation and to regain the trust of their customers quickly.
  4. Internal management: Public status pages can also serve as an important internal tool for a company’s IT team, providing them with a centralized view of all incidents and enabling them to quickly respond to and resolve any issues that may arise.
  5. Proactive management: Public status pages can be used to communicate planned maintenance or updates, which can help to minimize disruptions and improve the overall experience for customers.
  6. Data analysis: Public status pages can provide data on historical incidents, outages, and downtime, which can be used by the business to analyze, improve and optimize their service infrastructure and also to identify any potential bottlenecks.

When it should be updated?

A status page should be updated whenever there is a change in the status of a company’s products or services. Here are some common scenarios when a status page should be updated:

  1. New Endpoints  – When a company has new endpoints like servers and services, then new endpoints should be added to uptime monitoring and assigned to the public status page to be publicly seen.
  2. Maintenance periods – If a company is performing maintenance on its systems or services, the status page should be updated with information about the start and end times of the maintenance period, and any expected disruptions.

In general, it is important to keep the status page up-to-date with accurate and timely information so that customers and stakeholders have a clear understanding of the status of a company’s products or services. This can help to build trust and credibility and to minimize confusion and frustration during outages or maintenance periods.


How status page reduces company costs?

A status page can help reduce a company’s costs in several ways, particularly in terms of support and brand value:

  1. Support costs – By providing real-time information about the status of a company’s products or services, a status page can reduce the volume of support requests from customers. This can help to lower support costs and reduce the workload for support teams, as customers can get the information they need without having to contact support directly.
  2. Brand value – By providing real-time information about the status of a company’s products or services, a status page can help to protect a company’s brand value by demonstrating its commitment to reliability and transparency. A status page can also help to minimize the impact of outages or maintenance periods on a company’s reputation, as customers can see what is happening and why.

Overall, a status page can help to reduce costs and improve efficiency by providing customers with real-time information about the status of a company’s products or services, and by improving communication and problem resolution during outages or maintenance periods.

Which brands are using public status pages?

Many well-known brands have a public status page, including:

  1. Amazon Web Services (AWS) – AWS has a public status page to provide real-time information about the status of its cloud computing services. This helps to provide transparency and to keep customers informed about any issues or outages that may affect the availability of AWS services.
  2. Microsoft – Microsoft has a public status page to provide information about the status of its cloud services, including Office 365 and Azure. This helps to keep customers informed and to minimize the impact of outages or maintenance periods.
  3. Google – Google has a public status page to provide information about the status of its various services, including Google Workspace (formerly G Suite), Google Cloud, and Google Play. This helps to keep customers informed and to provide a single source of information about the status of Google services.
  4. Salesforce – Salesforce has a public status page to provide real-time information about the status of its cloud-based customer relationship management (CRM) platform. This helps to provide transparency and to minimize the impact of outages or maintenance periods on customers.
  5. Dropbox – Dropbox has a public status page to provide real-time information about the status of its cloud storage and collaboration platform. This helps to provide transparency and to minimize the impact of outages or maintenance periods on customers.

These brands have a public status page because they recognize the importance of providing accurate and up-to-date information about the status of their products or services. A public status page helps to build trust and credibility with customers and to minimize confusion and frustration during outages or maintenance periods.

Conclusion

In conclusion, having a public status page has become a best practice for companies that rely on cloud services and other online products. A status page provides real-time information about the status of a company’s products or services, helping to reduce support costs, increase customer satisfaction, and improve problem resolution. Many well-known brands, including AWS, Microsoft, Google, Salesforce, and Dropbox, have public status pages as a way to provide transparency, build trust with customers, and minimize the impact of outages or maintenance periods. In short, a public status page is an essential tool for any company that values customer communication, reliability, and transparency.

You can create your own public status page for FREE using Xitoring forever!
Public Status Page

Xitoring Launches Public Status Page

Leading provider of IT monitoring solutions, Xitoring, is pleased to announce the release of its brand-new solution for public status pages. Businesses can use the platform to build their own public status pages that update clients on the status of their goods and services in real time, including any known problems or outages.

The platform allows businesses to give their consumers real-time updates, notifications, and historical data. It is simple to use, configurable, and can be linked into a company’s own website. This enhances communication and transparency, assisting businesses in earning the trust of their clients by demonstrating their openness regarding any problems that might harm their service.

“When it comes to IT services, we at Xitoring recognize the value of openness and communication,” stated Xitoring Co-Founder Saman Soltani. “Our new tool enables businesses to design their own status pages, offering real-time information to their consumers regarding the operation of their services and any disruptions that may occur, assisting them in improving the overall customer experience.”

The public status feature is available for businesses of all sizes and can be accessed through Xitoring’s website. Businesses may start creating their own status pages after signing up for a free trial.

Xitoring is committed to providing businesses with the tools they need to improve communication and transparency with their customers. The public status page platform is the latest addition to the company’s offerings, and it is expected to help businesses to improve the performance and availability of their IT infrastructure.

Xitoring was introduced in 2021 with the goal of revolutionizing the server monitoring industry. The company’s automated platform is the latest addition to its offerings and is aimed at businesses that are tired of traditional ways of server monitoring and are looking for more efficient and automated solutions.

Sign up here to start creating your own status page within 5 minutes!

Read more on Public Status Page


Xitoring Launches new User Interface and Dashboard!

It’s very thrilling to announce that we have re-coded our whole user interface with the latest technologies using React v18 to improve the user experience. Our frontend engineers and product team is working very hard for daily builds, adding features, and applying bug fixes.

The mobile experience is improved significantly compared to the latest version, also we now have Dark mode!

New drag-and-dropable widgets on the dashboard let you have a glance at your Servers, Uptime Checks, Incidents, or account-related stuff like login sessions or billing.

Dark mode:

Light mode:

Xitoring Dashboard light mode


Stay tuned, we have plenty of good news to be announced shortly!

We are always reachable at support@xitoring.com if you have any questions or feedback.

Windows Server Monitoring

Xitoring now supports Windows Server monitoring!

We are thrilled to announce that Xitoring now offers Windows Server monitoring! It has been always a significant feature request from our customers to have this feature, and now we are very proud to have your requirement fulfilled =)

Our first product was Xigent v1 only supports a few Linux-based operating systems, then we went ahead developing a new version called v2 for Linux which now supports the major version of distributions. According to public statistics, Linux servers have about 15% of the market share and the rest belongs to Windows Servers which is about %73 of the market share. Our product will be very beneficial for Windows Server users we believe it has made the whole process much easier for them to Install, set up, and maintain. Our near competitors for Windows Server monitoring offers much more complex solution with higher rates. The belief and mindset behind our products are simplicity and ease of use, although the data we collect from servers are comprehensive. Your server will be connected to your nearest Xitoring node for the least network latency, and the date you sent, is fully analyzed and visualized.

We provide live statistics for Windows Server and also useful historical graphs for each component including CPU usage, Top Processes, Memory Usage, Disk usage, Disk IO, Network statistics, Netstat data, and much more!

The following versions of Windows Server are officially supported:

  • Windows Server 2012
  • Windows Server 2012 R2
  • Windows Server 2016
  • Windows Server 2019
  • Windows Server 2022

Right after your installation of Xitogent on your Windows Server, you will receive an email indicating your Server is successfully registered and added to monitoring. we automatically and optionally detect running services on your public IP address and create checks and triggers for them. supported check types at the moment are HTTP, HTTPS, DNS, FTP, POP3, IMAP, SMTP, PING, and a few more.

All Xitoring users can benefit from a free plan to monitor up to 5 servers at no cost! You can read the Xitoring Windows manual for more information.

Registration and adding a Windows server is exactly like the previous Linux installation, you need only to copy a command, paste it into your PowerShell, and the rest is done automatically.

You can always contact our support team if you need any help installing Windows Server Xitogent.

Read more about Windows Server monitoring solutions.

How metric monitoring increases server uptime?

Introduction

Everyone despises waiting for an application to load—or when an application fails to load. And if this occurs with your application, you will lose not only business but also brand value. Most applications are now available online. As a result, servers play an important role in keeping apps operating.

Server performance is directly related to application performance. As a result, monitoring and improving server performance is critical. There are various aspects to server performance. This post will look at various metrics that help analyze server performance and how we may enhance them. Then we’ll talk about how crucial server performance monitoring is and how to get started.

Server Performance

A measure of a server’s performance, in general, is called server performance. Yet what constitutes “well”? Every server is created, set up, and used for a certain purpose. For instance, mail servers are used to manage and distribute emails, and database servers are in charge of storing, processing, and interacting with data, and so forth. When a server delivers the requested service at the requested time, it is said to be operating effectively.

The measuring of server performance combines various parameters. You must first measure various server performance metrics before judgment regarding a server’s performance. Let’s now examine some of the most crucial server performance metrics and discuss ways to enhance them.

(more…)