Getting Started with Xitoring
Welcome to Xitoring! This guide helps you understand your options and set up your first monitoring in minutes. Whether you're monitoring servers, APIs, websites, or all of the above, we'll help you get started on the right path.
Quick Reference
- New to monitoring? Start with Understanding Your Options
- Ready to add monitoring? Jump to Choose Your Path
- Need help? Check the FAQ or Glossary
Understanding Your Monitoring Options
Xitoring provides two complementary types of monitoring that work together to give you complete visibility:
Server Monitoring (Internal View)
Monitor inside your servers using Xitogent, our lightweight Go-based agent. Collects real-time metrics like CPU, memory, disk usage, running processes, and integration-specific data (databases, web servers, caches).
Best for: Understanding resource usage, detecting bottlenecks, monitoring server health from the inside.
Uptime Monitoring (External View)
Monitor from outside using global nodes to test your services like users do. Checks HTTP/HTTPS endpoints, DNS resolution, TCP/UDP ports, SSL certificates, and heartbeat pings.
Best for: Verifying user-facing availability, detecting outages, monitoring APIs and websites, SSL expiration alerts.
Recommended: Use both together for complete visibility. Xitogent tells you "your server is under stress"; uptime checks tell you "your users can't reach you."
See FAQ: Server vs Uptime Monitoring for detailed comparison.
Choose Your Monitoring Path
Path A: "I Have Servers to Monitor"
Start here if you control servers (physical, VMs, cloud instances) and want internal metrics.
What You'll Do
- Install Xitogent on your servers (one command, < 1 minute)
- Wait for data to arrive (2-5 minutes for first metrics)
- Review Auto-Discovery recommendations in server view (5-10 minutes)
- Enable recommended integrations for databases/web servers
- Create your first trigger and notification role
Installation Guides
- Linux Servers: Linux Installation Guide
- Windows Servers: Windows Installation Guide
- Azure: Azure Deployment Guide
Timeline Expectations
| Milestone | Timeline | What's Happening |
|---|---|---|
| Xitogent installed | < 1 minute | Agent registers with Xitoring |
| First data arrives | 2-5 minutes | Initial metrics collected and sent |
| Auto-Discovery completes | 5-10 minutes | System scans for running services |
| Graphs fully populated | 10-15 minutes | Enough data points for trend visualization |
| Auto-Trigger recommendations | ~24 hours | System establishes full-day baseline thresholds |
Next Steps: Enable Integrations → Set Up Alerts
Path B: "I Monitor External Services/APIs"
Start here if you monitor websites, APIs, SSL certificates, or services you don't control directly.
What You'll Do
- Create your first uptime check (HTTP, DNS, Ping, TCP, etc.)
- Configure check settings (interval, expected response, timeout)
- Create triggers with conditions
- Set up notification roles for alerts
- Test your alerting setup
Check Types Available
- HTTP/HTTPS - Websites, APIs, REST endpoints
- DNS - Domain resolution monitoring
- Ping - Server reachability via ICMP
- TCP/UDP - Port connectivity for any service
- SSL Monitoring - Certificate expiration and validity
- Heartbeat - Cron job and scheduled task verification
- SMTP/IMAP/POP3 - Email server monitoring
- FTP - FTP server availability
Next Steps: Create Additional Checks → Set Up Status Page
Path C: "I Need Both"
Comprehensive monitoring combining internal server metrics with external availability checks.
Recommended Setup Order
- Start with servers - Install Xitogent for internal visibility
- Wait for discovery - Let Auto-Discovery find your services (5-10 min)
- Add uptime checks - Create external checks for user-facing services
- Enable integrations - Turn on database, web server, cache monitoring
- Unified alerting - Configure notification roles to cover both monitoring types
- Build dashboards - Create custom views combining server and uptime data
- Create status page - Public visibility into service health
Complete Workflow: Monitor First Server (Workflow) → Monitor API Endpoint (Workflow) → Setup Alerting (Workflow)
The New Monitoring Page
Access all monitoring creation from New Monitoring in the dashboard. This is your central hub for adding any type of monitoring.
Available Options
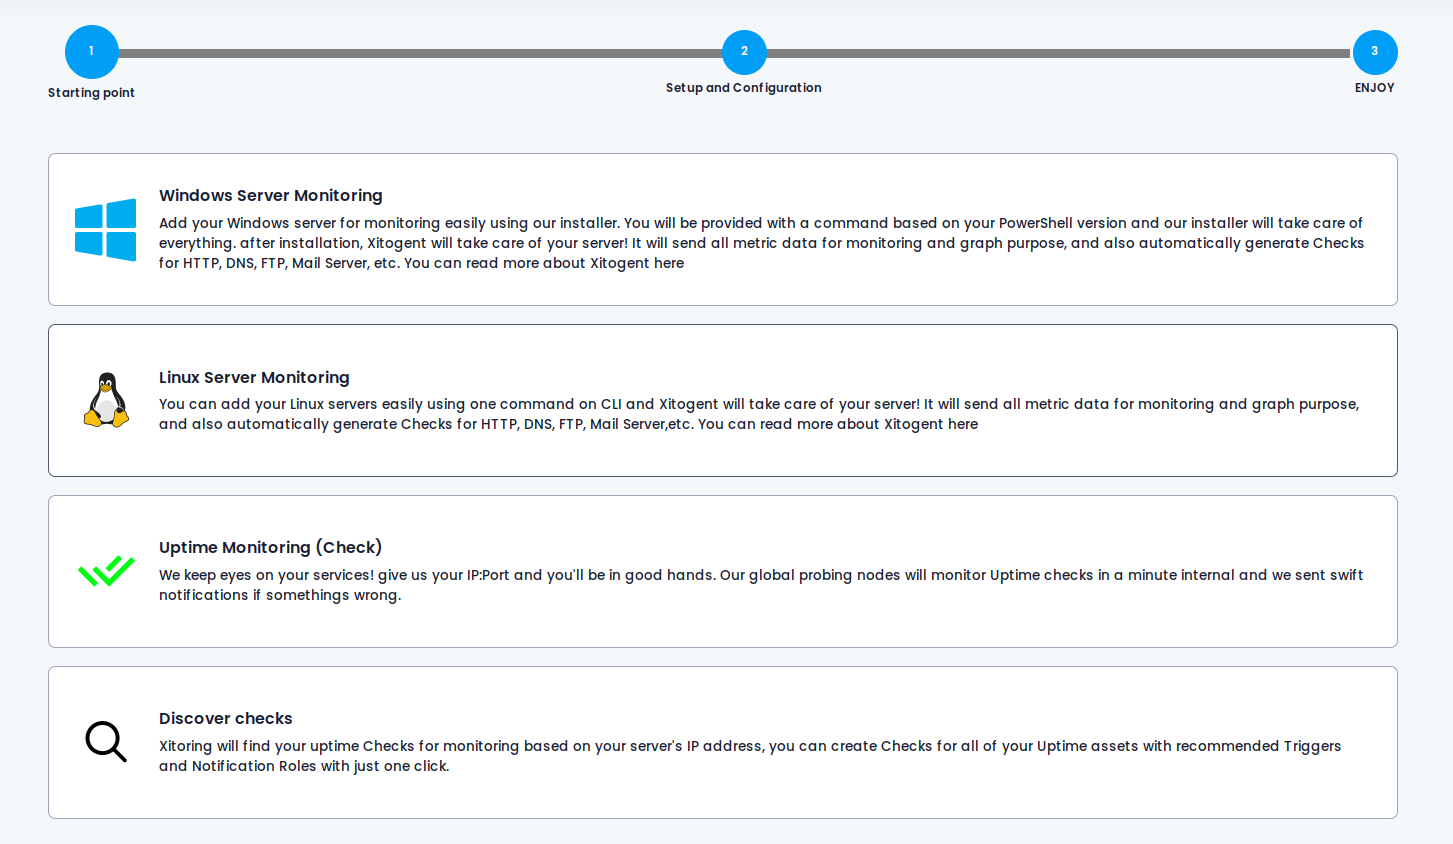
Linux Server Monitoring
Add Linux servers with a single command. The installer handles everything: registration, initial data collection, and service discovery. Supports all major distributions (Ubuntu, Debian, CentOS, RHEL, Rocky, Alma, Fedora, Arch).
Windows Server Monitoring
Add Windows servers with PowerShell command (Administrator). Xitogent version 2+ fully supports Windows with automatic check discovery and integration support.
Uptime Monitoring (Checks)
Create external uptime checks for HTTP(S), FTP, DNS, PING, SMTP, POP3, IMAP, TCP, UDP, and Heartbeat monitoring. Test from global nodes to verify user-facing availability.
API Monitoring
Advanced HTTP checks with custom headers, request bodies, authentication, and response parsing. Perfect for monitoring RESTful APIs, webhooks, and complex endpoints. See HTTP Monitoring for details.
Discover Checks
Automatic check creation for running services. Enter an IP address and Xitoring scans for active services, then creates appropriate checks automatically. Great for quick setup or unfamiliar environments.
SSL Monitoring
Monitor SSL certificates for any endpoint and port. Get alerts before certificates expire (30/14/7/1 days advance notice). Prevents embarrassing "untrusted certificate" errors.
Setting Up Your First Alert
Monitoring data is useful, but alerts make it actionable. Here's how alerts work in Xitoring:
The Alert Chain
- Metrics are collected - Server metrics or check results gathered
- Trigger condition met - Threshold exceeded (e.g., CPU > 85%)
- Fault Tolerance elapsed - Buffer period passed (prevents false alerts)
- Incident created - Alert event generated with root cause
- Notification Role activated - Alerts sent via configured channels
- Team notified - Email, SMS, Slack, PagerDuty, etc. deliver alerts
Quick Alert Setup
- Create Notification Role - Define who gets alerted and how (Notification Roles)
- Add Notification Channels - Email, SMS, Slack, Teams, PagerDuty, etc. (20+ integrations)
- Create Trigger - Define threshold and conditions (CPU > 85%, Response Time > 5000ms)
- Assign Notification Role - Connect trigger to notification role
- Test - Send test notification to verify delivery
See FAQ: Setting Up Alerting for detailed walkthrough.
Monitoring Specific Software (Integrations)
After installing Xitogent, enable integrations to get deep insights into specific software:
Database Integrations
Monitor connections, queries, replication, slow queries, buffer pools, and more.
Web Server Integrations
Monitor requests, response times, worker processes, connections, and throughput.
Message Queue Integrations
Monitor queue depth, message rates, consumer lag, and broker health.
System & Network Services
Browse all 30+ integrations: Integrations Hub
Creating Additional Monitoring
Add More Servers
- Use Ansible playbooks for bulk deployment
- Deploy via cloud-init scripts for auto-registration
- Manually repeat installation on each server
Add More Checks
Create as many uptime checks as needed from New Monitoring → Uptime Monitoring. Each check can monitor different aspects (response time, status code, content, SSL validity).
Organize with Groups
Use server groups to organize large deployments by environment (Production, Staging), tier (Web, Database, Cache), or location (US-East, EU-West).
What to Expect: Realistic Timelines
First 5 Minutes
- ✅ Xitogent installed on one server
- ✅ First uptime check created and running
- ⏱️ Waiting for first data (be patient!)
First 15 Minutes
- ✅ Server metrics visible (CPU, memory, disk graphs)
- ✅ Uptime check results showing (response time, status)
- ✅ Auto-Discovery has scanned for services
- ⏱️ Integration data starting to arrive
First 30 Minutes
- ✅ Integration metrics fully visible (database, web server stats)
- ⏱️ Auto-Trigger recommendations pending (available after ~24 hours)
- ✅ First triggers created and tested
- ✅ Notification roles configured
- ✅ Test alerts successfully delivered
First Hour
- ✅ Multiple servers monitored (if using Ansible)
- ✅ Status page created and configured
- ✅ Custom dashboard built
- ✅ Team members invited
- 🎉 Full monitoring operational!
Next Steps After Initial Setup
Expand Monitoring
- Enable more integrations - Database, web server, cache monitoring
- Add uptime checks - Monitor user-facing services externally
- Monitor SSL certificates - Prevent expiration surprises
Build Visibility
- Create custom dashboards - Tailor views for different teams
- Set up status page - Public or private service status visibility
- Configure email reports - Scheduled summaries delivered to inbox
Optimize Alerting
- Understand triggers - Create effective alert rules
- Configure Fault Tolerance - Prevent alert fatigue
- Use notification roles wisely - Right alerts to right people
Team Collaboration
- Invite team members - Share monitoring access
- Set up maintenance windows - Suppress alerts during planned work
- Integrate with tools - Slack, PagerDuty, Teams, webhooks
Advanced Features
- Use Xitoring CLI - Automate via command line
- Leverage the API - Programmatic control (external documentation)
- Import from competitors - Migrate from Pingdom, BetterStack, Uptime.com, UptimeRobot
Getting Help
Documentation Resources
- FAQ - 30+ common questions and troubleshooting tips
- Glossary - 60+ term definitions and concepts
- Integration Guides - Software-specific monitoring setup
- Notification Channels - 20+ alert delivery options
Common Questions
- What is Xitoring and why choose it?
- Server vs Uptime Monitoring explained
- Xitogent installation troubleshooting
- Setting up incident alerting
- Understanding automation features
Support
If you can't find answers in the documentation:
- Check the FAQ for your specific question
- Search the Glossary for term definitions
- Review integration-specific guides in Integrations
- Contact support through the dashboard
Ready to start monitoring? Head to the New Monitoring page in your dashboard and choose your path!