Custom Dashboards
Custom dashboards allow users to create tailored views by adding widgets that display graphical representations of data. Unlike the static main dashboard, custom dashboards are dynamic and fully customizable, enabling users to build unique dashboards that suit their specific needs. This section provides a detailed explanation of custom dashboards, how to manage widgets, and the available customization options.
See Custom Dashboards for a feature overview.
Overview of Custom Dashboards
Custom dashboards are designed to offer flexibility and personalization. Users can create multiple dashboards, configure their layouts, and add widgets to visualize data in meaningful ways. Key features include:
- Full control over widgets (creation, editing, and deletion).
- Multiple dashboard layouts (2-column, 3-column, and 4-column views).
- Advanced options for syncing themes and filtering data.
- Graphical data visualization with widgets.
Managing Widgets in Custom Dashboards
1. Creating a Widget
Widgets in custom dashboards are graphs that visualize either server metrics or uptime checks. To create a widget:
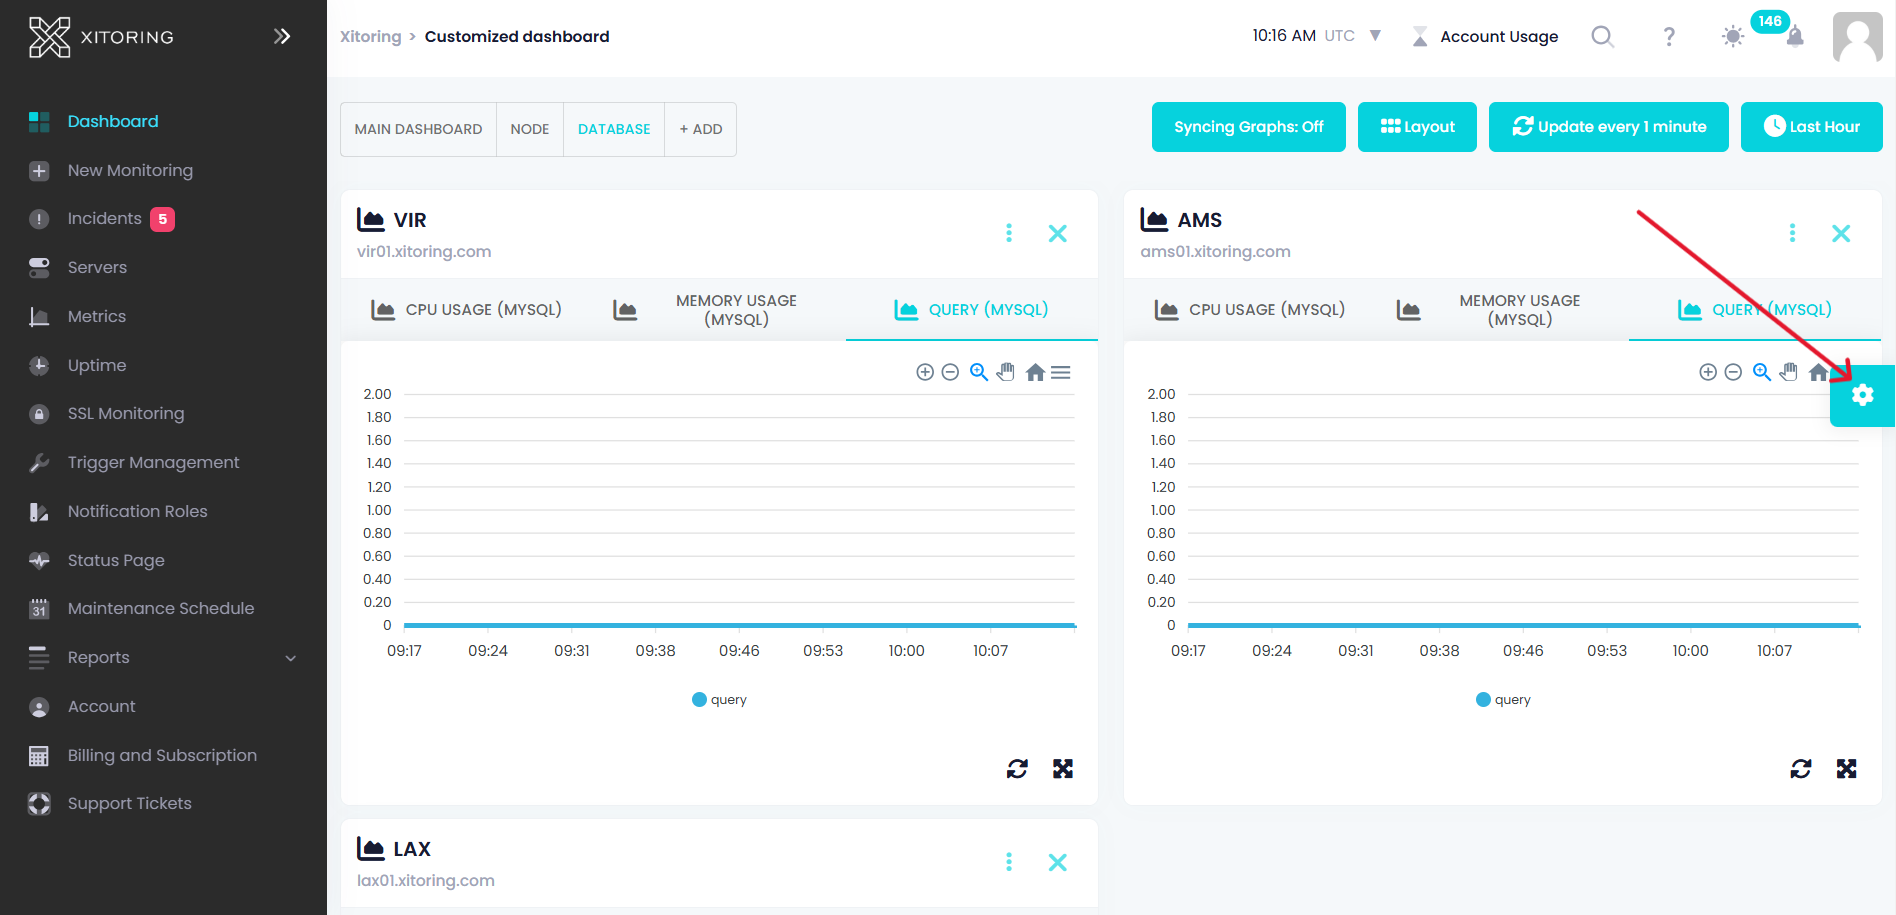
- Access the Dashboard Settings: Click the Settings button in the custom dashboard.
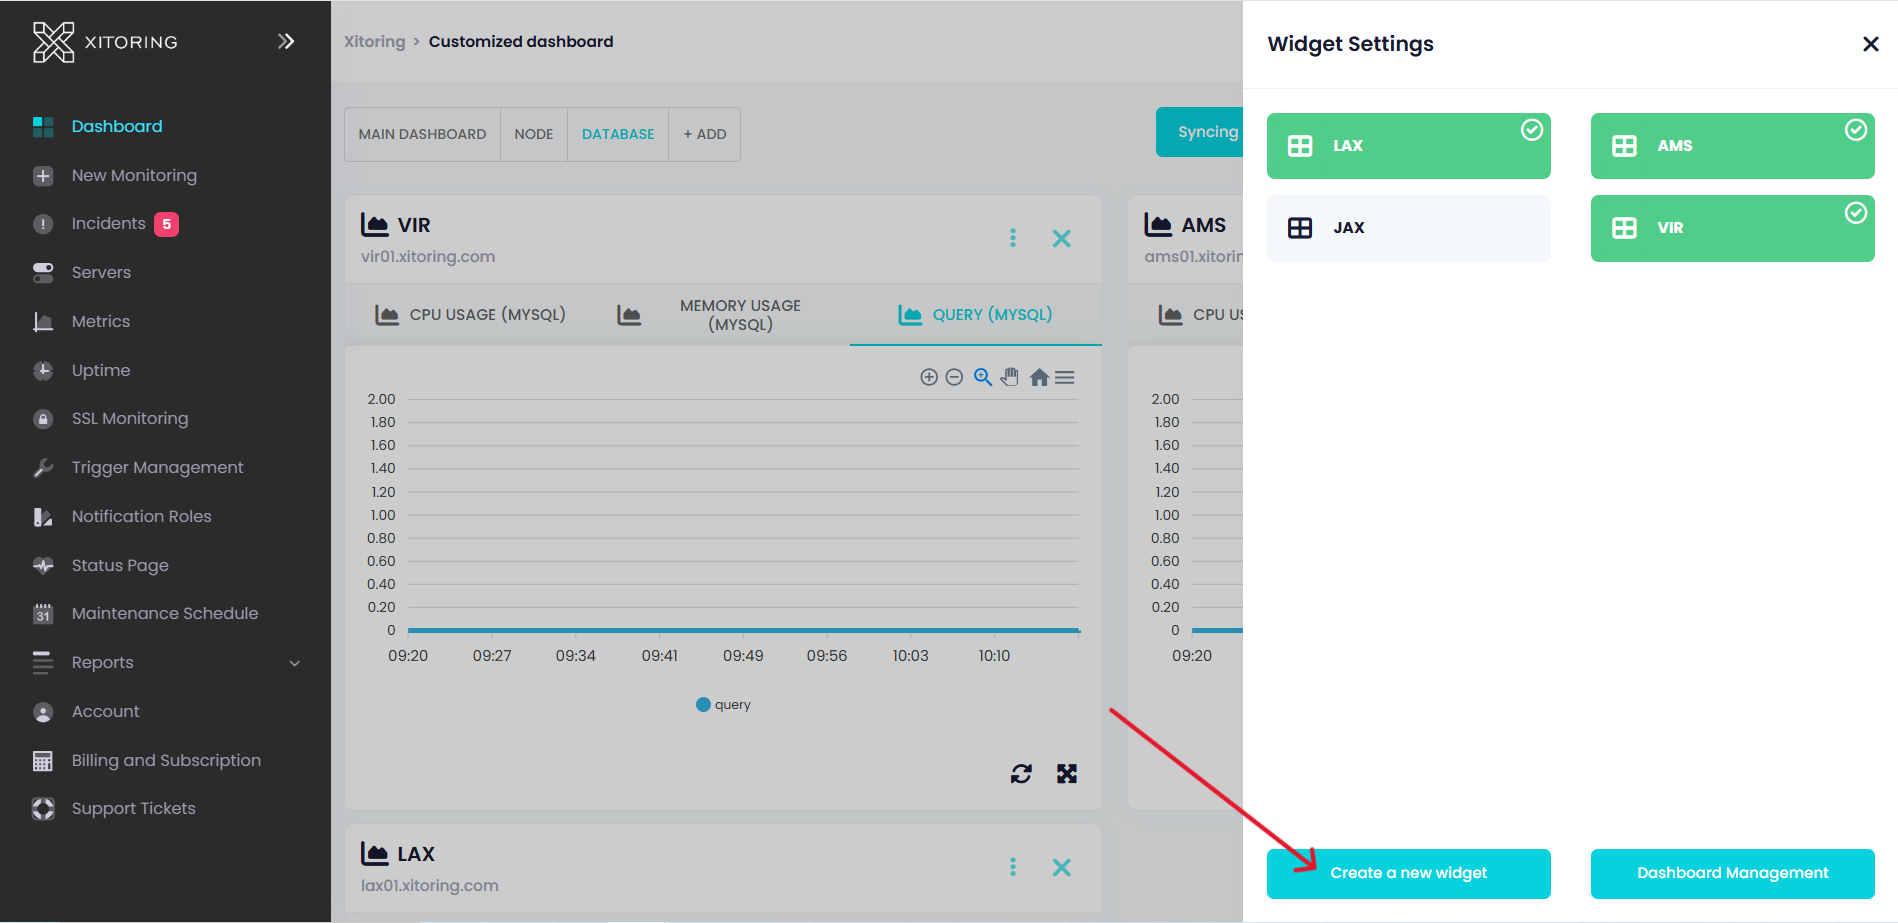
- Select "Create a New Widget": This action opens a modal where the widget configuration begins.
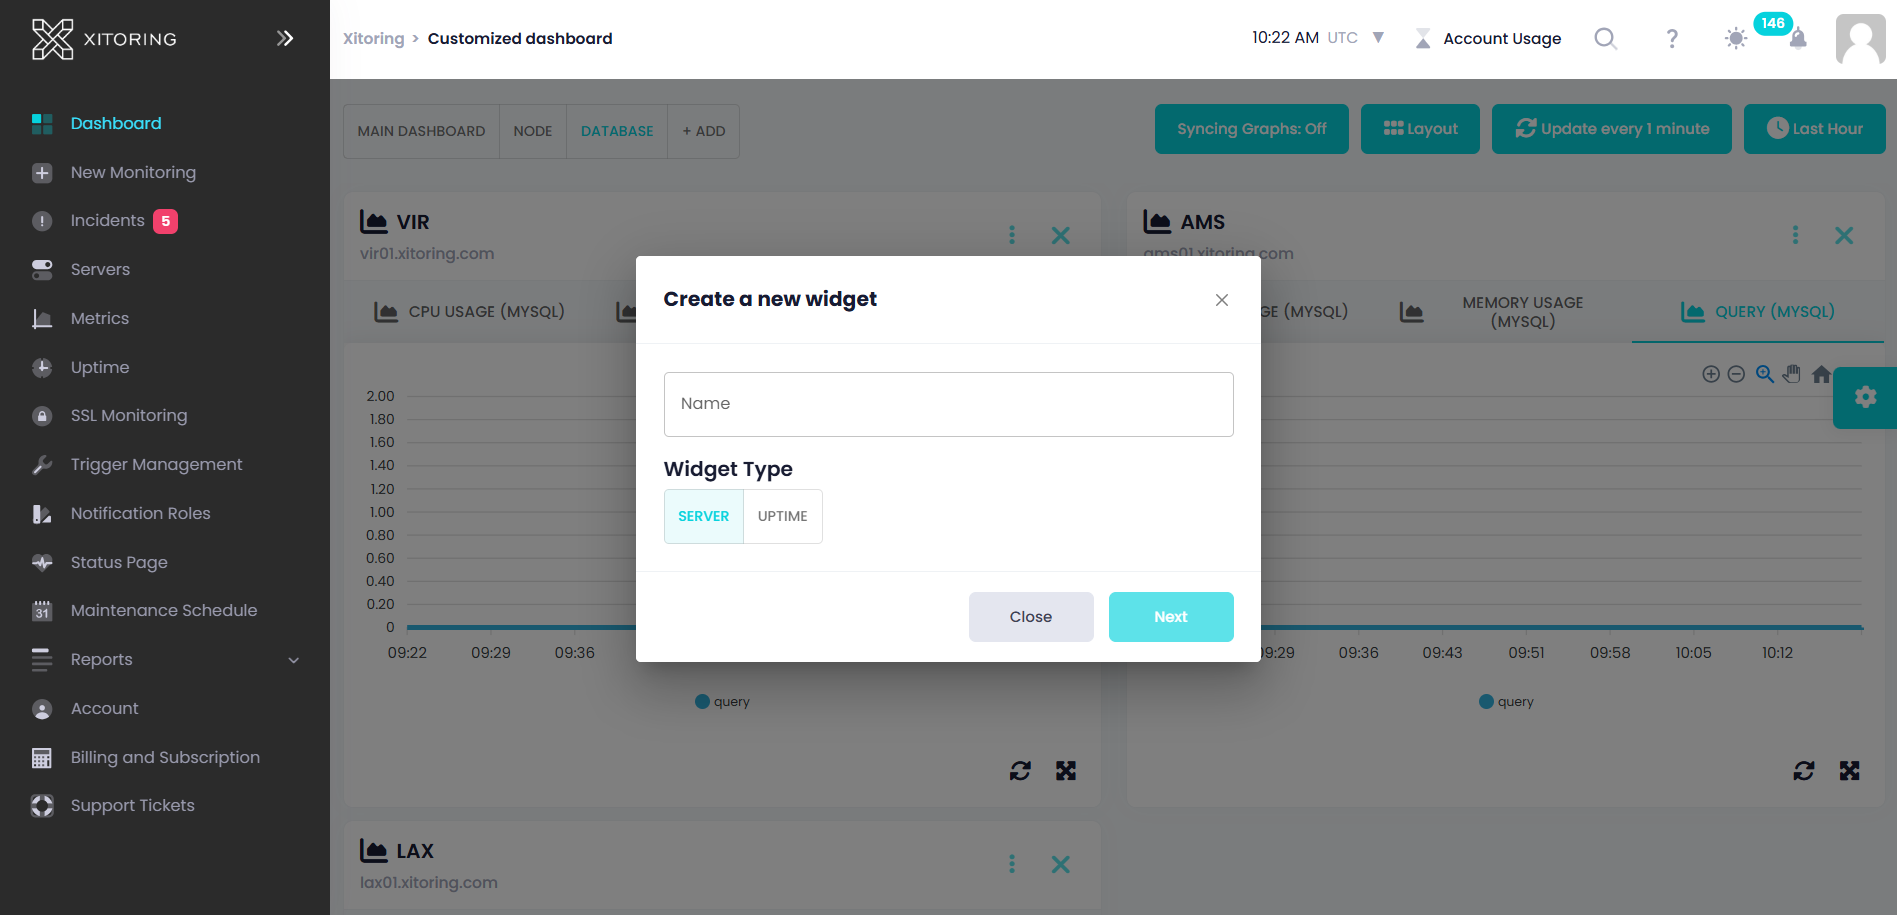
- Name the Widget: Enter a meaningful name to identify the widget.
- Choose the Widget Type: Select one of the following:
- Server: Visualizes server-related data.
- Uptime: Displays uptime monitoring graphs (ping or HTTP checks).
Configuring a "Server" Widget
- Select a Server: From the provided list, choose the server to be monitored.
- Select a Graph Type:
- Metric Graphs: Displays specific server metrics such as CPU usage, memory, or network traffic.
- Integration Graphs: Shows data from third-party integrations.
Configuring an "Uptime" Widget
- Choose Uptime Checks: A list of uptime checks (e.g., ping or HTTP monitoring) is displayed.
- Select a Check: Pick the desired uptime check to create its graph visualization.
2. Editing a Widget
To modify an existing widget: 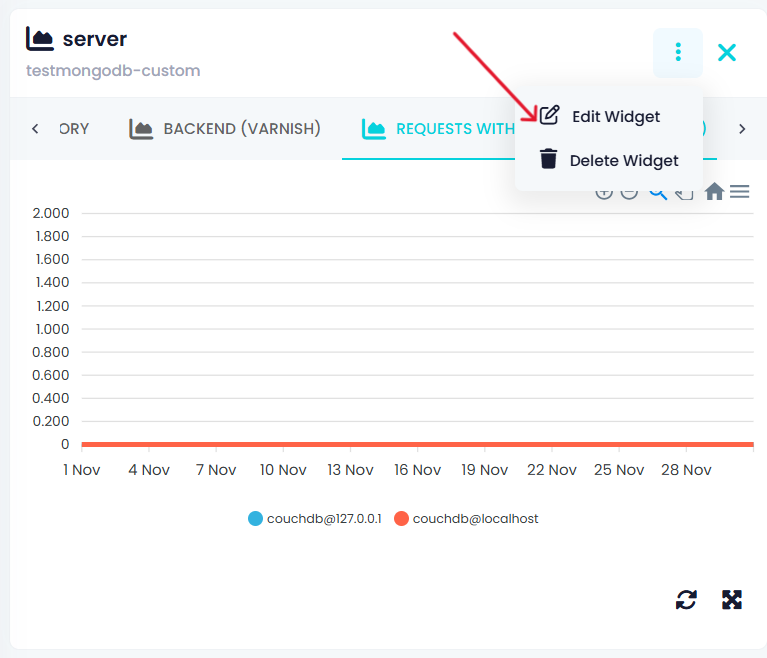
- Click on the Edit Widget button on the widget menu .
- Update the widget name, type, or configuration as needed.
- Save the changes to apply the new settings.
3. Removing a Widget
Users can delete widgets that are no longer needed: 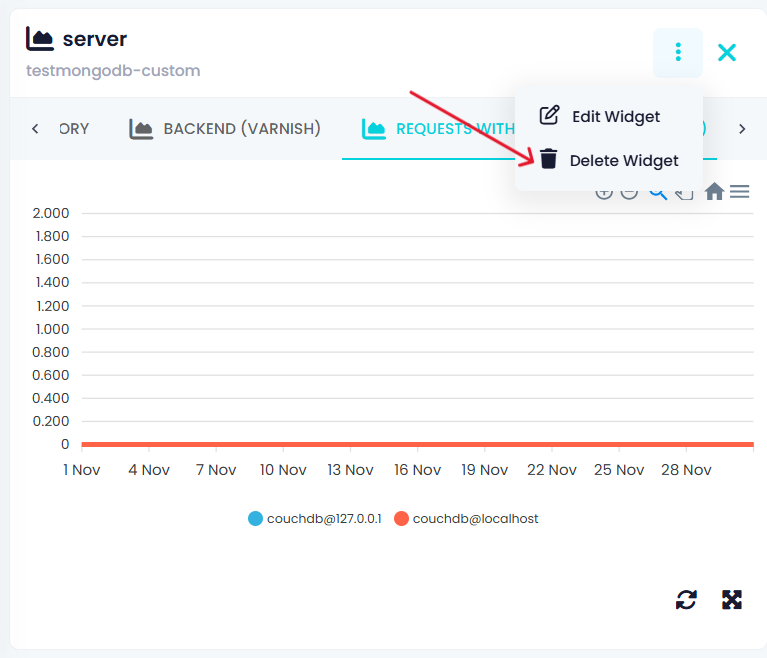
- Click the Remove Widget button on the widget menu .
- Confirm the action to permanently delete the widget.
4. Reordering Widgets
Widgets can be rearranged using the drag-and-drop interface:
- Click and hold a widget.
- Drag it to the desired position.
- Drop the widget in place to reorder it.
5. Enabling/Disabling Widgets
Users can toggle widgets on or off:
- Access the widget settings.
- Use the toggle to enable or disable the widget as required.
Custom Dashboard Features and Options
Custom dashboards provide additional customization options that enhance usability and data visualization.
1. Dashboard Filters and Options
Custom dashboards include advanced filtering and layout options:
- Graph Synchronization: Custom dashboards support synchronizing graphs. When enabled, interactions (e.g., zooming or panning) on one graph will apply to all graphs within the same dashboard. This ensures consistent visualization across widgets.
- Change Layout: Choose from the following layouts:
- 2-column view.
- 3-column view.
- 4-column view.
- Interval Updates: Configure the time interval for fetching new data for graphs (e.g., every 1 minute, 5 minutes, etc.).
- Period Filters: Apply time-based filters to control the data displayed in the graphs (e.g., Last 24 hours,Last 7 days, etc.)
2. Default Dashboard Settings
Users can designate any custom dashboard as the default:
- Open the Dashboard Management modal.
- Select the desired custom dashboard and set it as the default.
Managing Custom Dashboards
To manage custom dashboards, click the Dashboard Management button. This opens a modal where users can:
- Add a New Dashboard: Create additional dashboards to organize widgets based on specific needs or contexts.
- Edit an Existing Dashboard: Modify dashboard names or settings.
- Remove Dashboards: Delete dashboards no longer in use.
- Set a Default Dashboard: Choose which dashboard should load by default when the application starts.
Accessing Shared Dashboards
- Sub-accounts can view custom dashboards shared by their main account in the Dashboard Management modal under the Shared Dashboards section.
- Shared dashboards are displayed alongside their own custom dashboards for easy management.
Adding Shared Dashboards to Personal Dashboards
Sub-accounts can integrate shared dashboards into their personal custom dashboards: 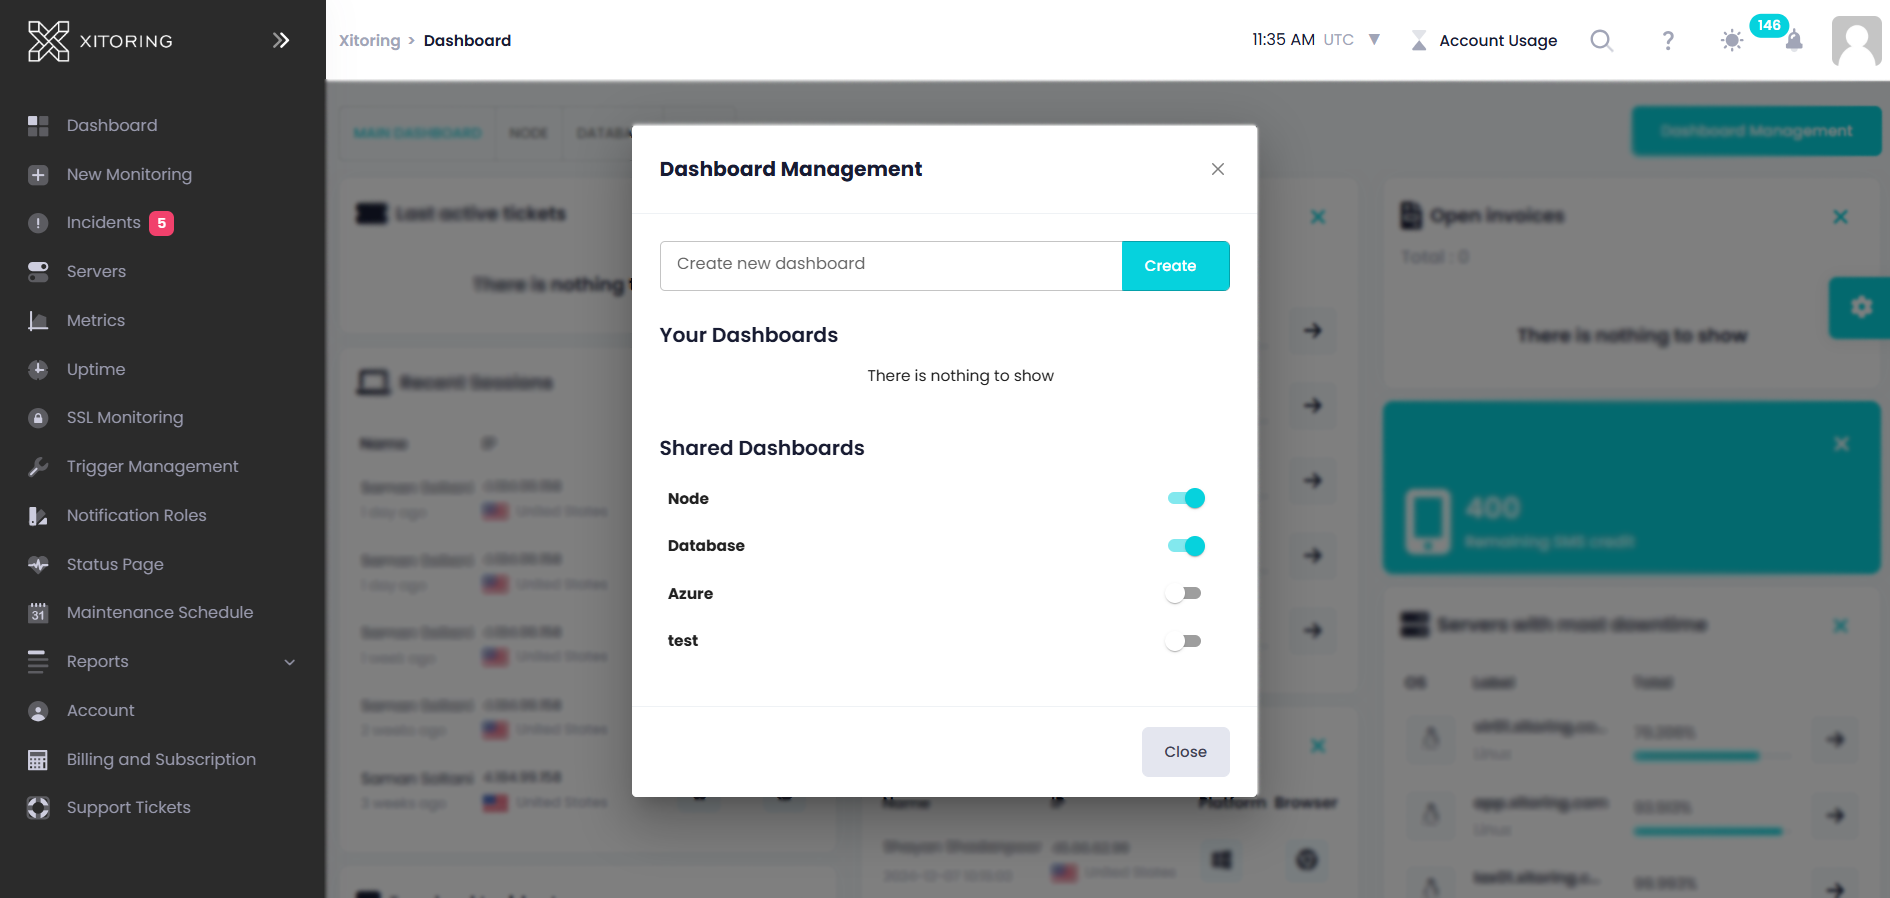
- Navigate to the Shared Dashboards section in the Dashboard Management modal.
- Locate the desired shared dashboard.
- Use the Toggle to add or remove the shared dashboard from your own custom dashboards.
Shared dashboards enhance custom dashboard functionality, enabling seamless collaboration and efficient resource utilization within teams or organizations.
Benefits of Custom Dashboards
- Personalization: Allows users to build dashboards tailored to their workflow.
- Flexibility: Supports multiple dashboards with different layouts and widgets.
- Efficiency: Provides quick access to relevant data through advanced filtering and visualization options.
Use Cases for Custom Dashboards
- Monitoring Server Performance: Create widgets to monitor metrics like CPU, memory, or disk usage in real time.
- Tracking Uptime: Visualize uptime checks for critical services to ensure availability.
- Custom Reporting: Design dashboards for specific teams or projects, focusing on relevant data.
Custom dashboards provide a highly customizable solution for users to manage and visualize data effectively. By offering widget-level and dashboard-level personalization, they empower users to create meaningful, task-specific dashboards tailored to their unique needs.