Xitoring Document
Home
FAQ
Support
Register
Home
FAQ
Support
Register
  • Xitoring

    • Introduction
    • Release Notes
    • Xitoring Release Notes
    • Linux Xitogent Release Notes
    • Windows Xitogent Release Notes
    • Xitoring Mobile App Release Notes
    • Account Management
    • API Access & Automation
    • Team Management & Collaboration
    • Billing & Subscription Management
  • Getting Started

    • Getting Started with Xitoring
    • Workflows & Guides
    • Monitor Your First Server
    • Import / Migration
    • Migrate from UptimeRobot to Xitoring
    • Migrate from Pingdom to Xitoring
    • Migrate from Uptime.com to Xitoring
    • Migrate from BetterStack to Xitoring
  • Help & Support

    • FAQ & Troubleshooting
    • Glossary
  • Server Monitoring

    • Server Monitoring
    • Graphs
    • Live Statistics
    • Monitor Services
    • Auto-Triggers
  • Xitogent on Linux

    • Install Xitogent on Linux
    • Update Xitogent on Linux
    • Uninstall Xitogent on Linux
  • Xitogent on Windows

    • Install Xitogent on Windows
    • Uninstall Xitogent on Windows
    • Xitogent Service
    • Update Xitogent on Windows
    • Disk Performance (I/O)
  • Xitogent on Azure

    • Xitogent on Azure
    • Monitor Azure Linux VM
    • Monitor Azure Windows VM
  • Xitogent CLI

    • Xitogent CLI
    • Xitogent Pause/Unpause
    • Xitogent Status
    • Xitogent debug
    • Xitogent Diagnosis
    • Which data we collect
  • Xitoring CLI

    • Xitoring CLI
  • Uptime Monitoring

    • What is Uptime Monitoring
    • Monitoring Nodes (Geographic Locations)
    • What is Check
    • Auto-Discovery
    • Auto Fault Tolerance
    • Heartbeat Check
    • Ping Check
    • HTTP(S) Check
    • DNS Check
    • FTP Check
    • SMTP Check
    • IMAP Check
    • POP3 Check
    • TCP Check
    • UDP Check
  • SSL Monitoring

    • SSL Monitoring
  • Incidents

    • Incidents
    • Incident's Root Cause
    • Incidents Notification
    • Incident Notes
    • Resolving Incidents Manually
    • Incident Policy
  • Maintenance Schedule

    • Maintenance Schedule
  • Email Reports

    • Email Reports
  • Integrations

    • Integrations
    • Apache Integration
    • CoreDNS Integration
    • CouchDB Integration
    • Disk Health Integration
    • Docker Integration
    • Dovecot Integration
    • Exim Integration
    • HAProxy Integration
    • IIS Integration
    • InfluxDB Integration
    • Kafka Integration
    • KeyDB Integration
    • LiteSpeed Integration
    • MongoDB Integration
    • MySQL Integration
    • Netstat Integration
    • Nginx Integration
    • OpenLiteSpeed Integration
    • OpenVPN Integration
    • PHP-FPM Integration
    • Postfix Integration
    • PostgreSQL Integration
    • RabbitMQ integration
    • Redis Integration
    • MS SQL Server Integration
    • Supervisor Integration
    • Varnish Integration
    • Wireguard Integration
  • Notifications

    • Notifications
    • Creating Notification Roles
    • Email Integration
    • Mobile Push Notifications
    • SMS Integration
    • Phone call Integration
    • Webhook Integration
    • Integration for Slack
    • Telegram Integration
    • WhatsApp Integration
    • Mattermost Integration
    • Discord Integration
    • Google Chat Integration
    • Microsoft Teams Integration
    • Atlassian Opsgenie Integration
    • Splunk On-Call Integration
    • Pushover Integration
    • Pushbullet Integration
    • Gotify Integration
    • Ntfy Integration
    • Spike.sh Integration
    • PagerDuty Integration
    • Zapier Integration
    • AlertOps Integration
  • Status Page

    • Status page
  • 3rd Party Status Pages

    • Using 3rd party Status Pages
    • Atlassian Status Page Integration with Xitoring
    • Status.io Integration with Xitoring
    • Statuspal Integration with Xitoring
    • Instatus Integration with Xitoring
  • Dashboards

    • Main Dashboard
    • Custom Dashboards
  • Metrics

    • Metrics
  • MCP Server

    • Setup & Tool Reference

Server Monitoring

As it's clear from the name Server monitoring will monitor the whole server, including all of the server's resources data. using Server Monitoring you can obtain information about your used resources and what is consuming most of the resources of your server in the fastest possible way, simultaneously it will automatically detect and create Checks for your running services for Uptime Monitoring.

Xitoring light weight agent, named Xitogent, should be installed on your Linux or Windows server to use Server Monitoring.

See the Server Monitoring product page for a feature overview, or the platform-specific pages for Linux and Windows.
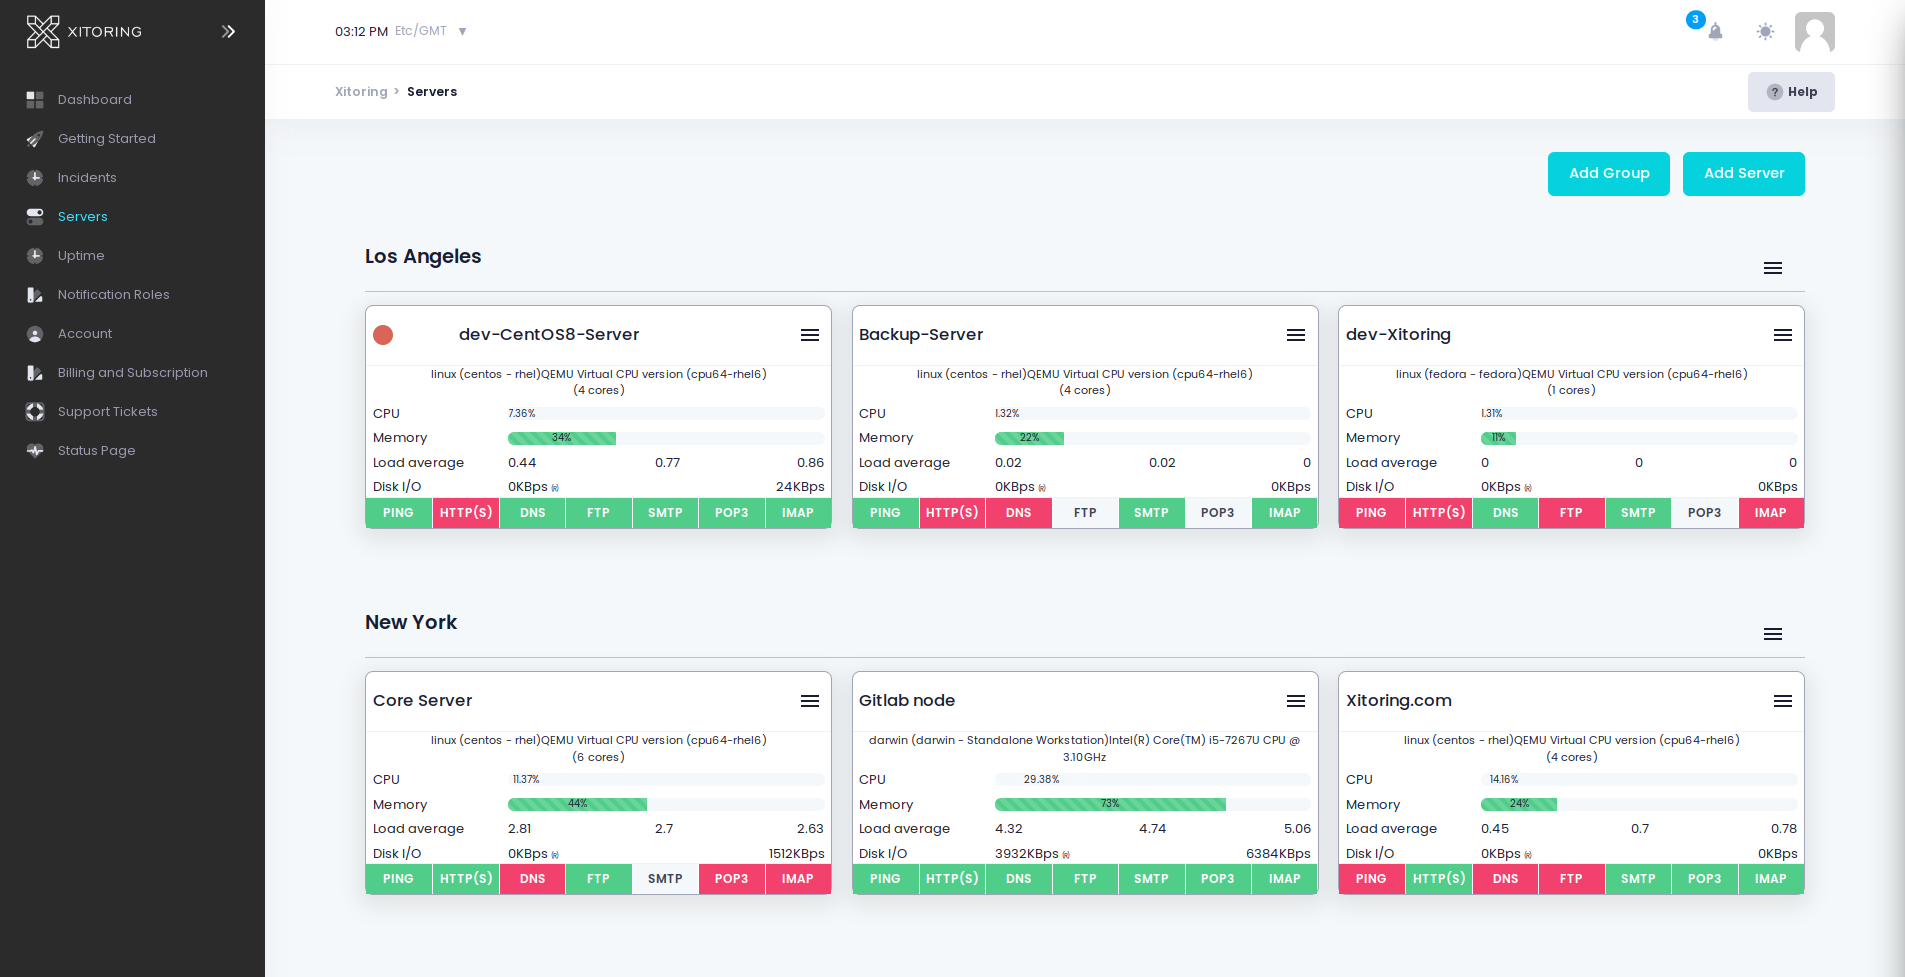
Xitoring Servers overview Page

Which system Statistics do we collect

Statistics are data about the resources of your server, Keep track of consumed resources in real-time can be very important for managing a server, below is a list of statistics that you can keep track of when your server is being monitored by Xitoring.

  • CPU Usage
  • Load Average
  • Disk Usage
  • Memory Usage
  • Network
  • Network Packet
  • Network Dropped
  • Disk I/O
  • Services
  • Netstat

Tips

If you have server integrations enabled, Xitogent will collect essential statistics to generate graphs, and send alerts when something is wrong.

Creating Triggers for Server Monitoring

Triggers are not limited to Checks and Uptime monitoring, A default Trigger will be created for all of your server's resources upon adding a server to the panel, You can create and edit more triggers and assign different notification roles to them from the Server overview page.

Last Updated: 7/27/26, 5:07 PM
Next
Graphs