Xitoring Document
Home
FAQ
Support
Register
Home
FAQ
Support
Register
  • Xitoring

    • Introduction
    • Release Notes
    • Xitoring Release Notes
    • Linux Xitogent Release Notes
    • Windows Xitogent Release Notes
    • Xitoring Mobile App Release Notes
    • Account Management
    • API Access & Automation
    • Team Management & Collaboration
    • Billing & Subscription Management
  • Getting Started

    • Getting Started with Xitoring
    • Workflows & Guides
    • Monitor Your First Server
    • Import / Migration
    • Migrate from UptimeRobot to Xitoring
    • Migrate from Pingdom to Xitoring
    • Migrate from Uptime.com to Xitoring
    • Migrate from BetterStack to Xitoring
  • Help & Support

    • FAQ & Troubleshooting
    • Glossary
  • Server Monitoring

    • Server Monitoring
    • Graphs
    • Live Statistics
    • Monitor Services
    • Auto-Triggers
  • Xitogent on Linux

    • Install Xitogent on Linux
    • Update Xitogent on Linux
    • Uninstall Xitogent on Linux
  • Xitogent on Windows

    • Install Xitogent on Windows
    • Uninstall Xitogent on Windows
    • Xitogent Service
    • Update Xitogent on Windows
    • Disk Performance (I/O)
  • Xitogent on Azure

    • Xitogent on Azure
    • Monitor Azure Linux VM
    • Monitor Azure Windows VM
  • Xitogent CLI

    • Xitogent CLI
    • Xitogent Pause/Unpause
    • Xitogent Status
    • Xitogent debug
    • Xitogent Diagnosis
    • Which data we collect
  • Xitoring CLI

    • Xitoring CLI
  • Uptime Monitoring

    • What is Uptime Monitoring
    • Monitoring Nodes (Geographic Locations)
    • What is Check
    • Auto-Discovery
    • Auto Fault Tolerance
    • Heartbeat Check
    • Ping Check
    • HTTP(S) Check
    • DNS Check
    • FTP Check
    • SMTP Check
    • IMAP Check
    • POP3 Check
    • TCP Check
    • UDP Check
  • SSL Monitoring

    • SSL Monitoring
  • Incidents

    • Incidents
    • Incident's Root Cause
    • Incidents Notification
    • Incident Notes
    • Resolving Incidents Manually
    • Incident Policy
  • Maintenance Schedule

    • Maintenance Schedule
  • Email Reports

    • Email Reports
  • Integrations

    • Integrations
    • Apache Integration
    • CoreDNS Integration
    • CouchDB Integration
    • Disk Health Integration
    • Docker Integration
    • Dovecot Integration
    • Exim Integration
    • HAProxy Integration
    • IIS Integration
    • InfluxDB Integration
    • Kafka Integration
    • KeyDB Integration
    • LiteSpeed Integration
    • MongoDB Integration
    • MySQL Integration
    • Netstat Integration
    • Nginx Integration
    • OpenLiteSpeed Integration
    • OpenVPN Integration
    • PHP-FPM Integration
    • Postfix Integration
    • PostgreSQL Integration
    • RabbitMQ integration
    • Redis Integration
    • MS SQL Server Integration
    • Supervisor Integration
    • Varnish Integration
    • Wireguard Integration
  • Notifications

    • Notifications
    • Creating Notification Roles
    • Email Integration
    • Mobile Push Notifications
    • SMS Integration
    • Phone call Integration
    • Webhook Integration
    • Integration for Slack
    • Telegram Integration
    • WhatsApp Integration
    • Mattermost Integration
    • Discord Integration
    • Google Chat Integration
    • Microsoft Teams Integration
    • Atlassian Opsgenie Integration
    • Splunk On-Call Integration
    • Pushover Integration
    • Pushbullet Integration
    • Gotify Integration
    • Ntfy Integration
    • Spike.sh Integration
    • PagerDuty Integration
    • Zapier Integration
    • AlertOps Integration
  • Status Page

    • Status page
  • 3rd Party Status Pages

    • Using 3rd party Status Pages
    • Atlassian Status Page Integration with Xitoring
    • Status.io Integration with Xitoring
    • Statuspal Integration with Xitoring
    • Instatus Integration with Xitoring
  • Dashboards

    • Main Dashboard
    • Custom Dashboards
  • Metrics

    • Metrics
  • MCP Server

    • Setup & Tool Reference

Metrics

The Metrics page on Xitoring allows users to visualize and analyze server performance and integration data through interactive graphs. Users can select multiple servers for comparison, enabling a comprehensive view of their infrastructure's health and performance. metrics page
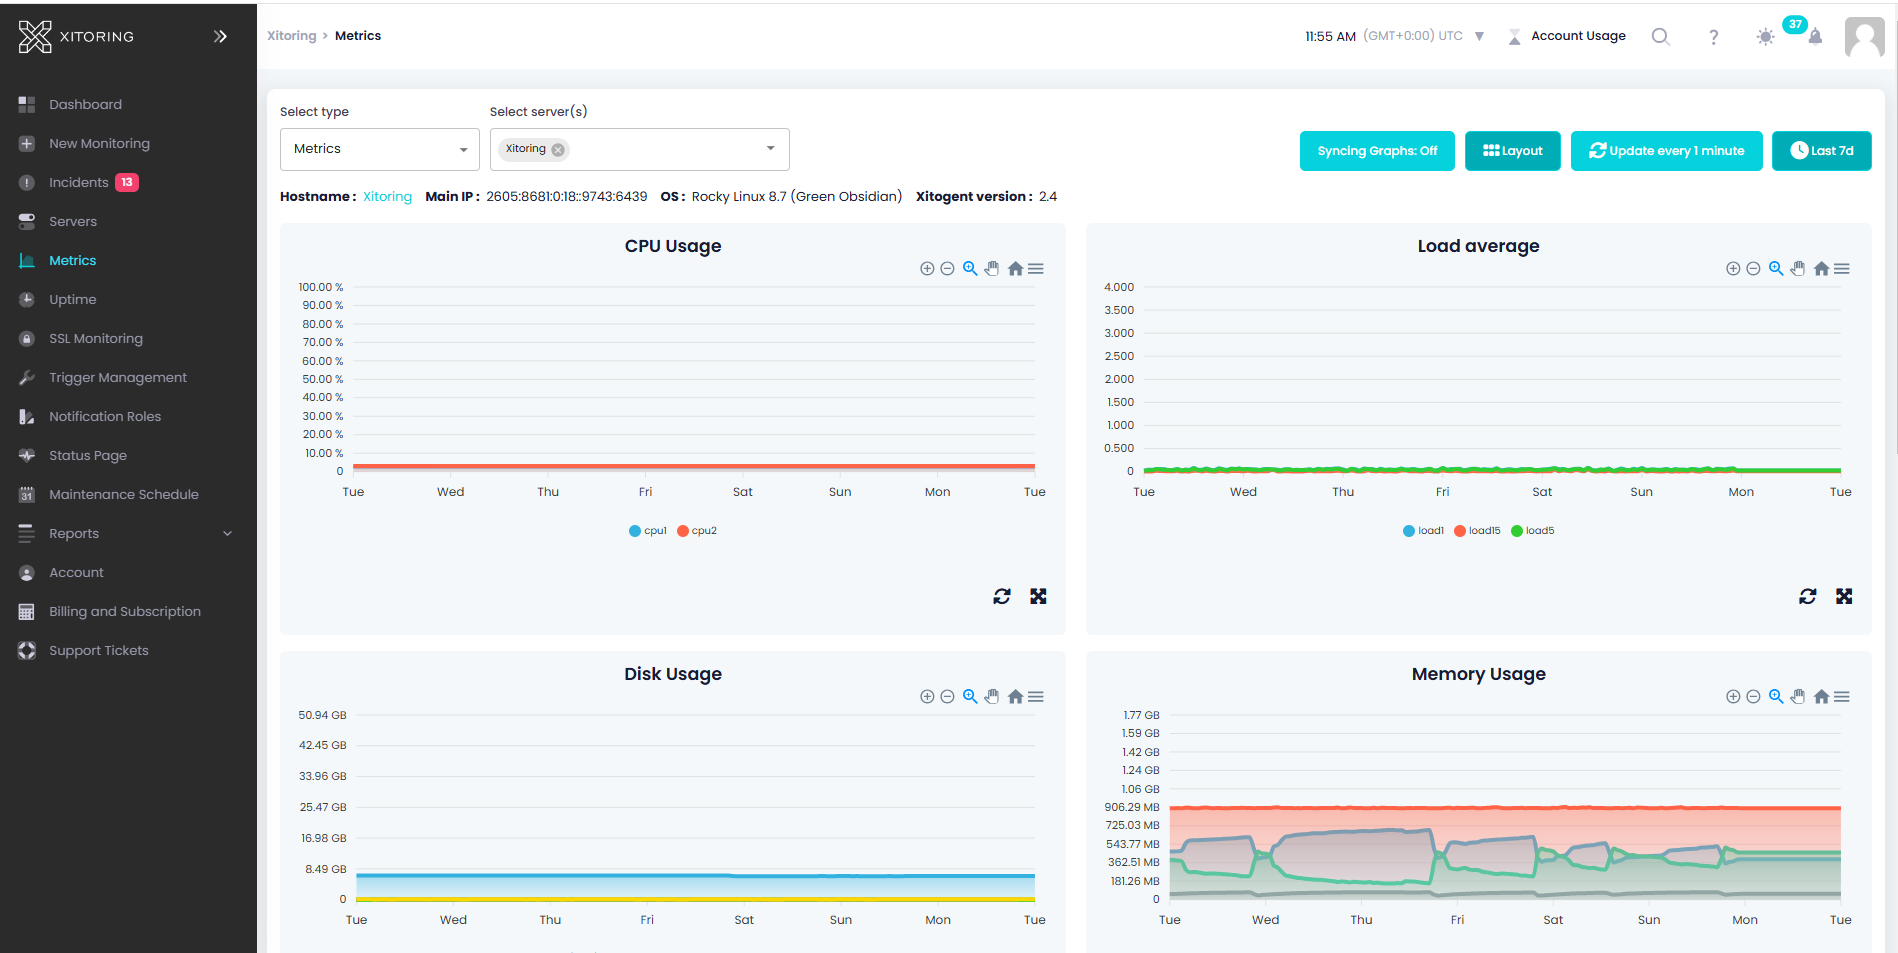
Overview of Metrics

The Metrics page provides detailed insights into various aspects of your servers and integrations. Users can select from a variety of metric types and integration data to create informative visualizations. Key features include:

  • Multiple Server Comparison: Select two or more servers to compare their metrics side-by-side.
  • Integration Graphs: Visualize data from supported third-party integrations.
  • Customizable Metrics: Choose from a variety of metric types to tailor your analysis.

Available Integration Types

Xitoring supports a range of integration types, each providing specific data points for analysis. The available types include:

  • Nginx
  • Netstat
  • Apache
  • PHP-FPM
  • Redis
  • KeyDB
  • Supervisor
  • Docker
  • MySQL
  • MongoDB
  • HAproxy
  • PostgreSQL
  • IIS
  • RabbitMQ
  • Disk Health
  • Varnish
  • CouchDB

Metric Types

When metric type is selected, these graphs appear to provide insights into server performance:

  • Load Average: Graphs appear showing the system's load over a specified period.
  • CPU Usage: Graphs appear tracking the percentage of CPU capacity being used.
  • Memory Usage: Graphs appear depicting the amount of memory being utilized.
  • Disk Usage: Graphs appear that check the storage space usage on your disks.
  • Disk I/O: Graphs appear analyzing input/output operations on disk.
  • Network: Graphs appear viewing network traffic and usage patterns.

Using the Metrics Page

Selecting Metrics and Servers

  1. Choose a Metric Type: Use the metric selector to pick the type of data you wish to analyze.
  2. Select Servers for Comparison: You can choose multiple servers to compare their metrics simultaneously.
  3. View Integration Data: Access integration-specific graphs by selecting the desired integration type from the list.

Interacting with Graphs

  • Zoom and Pan: Interact with graphs by zooming in for a detailed view or panning across time ranges.
  • Apply Filters: Use time-based filters to adjust the data displayed (e.g., Last 24 hours, Last 7 days).
  • Synchronize Graphs: Enable graph synchronization to apply interactions across multiple graphs for consistent analysis.

Filters and Options

  • Graph Synchronization: metric page support synchronizing graphs. When enabled, interactions (e.g., zooming or panning) on one graph will apply to all graphs within the same page. This ensures consistent visualization across widgets.
  • Change Layout: Choose from the following layouts:
    • 2-column view.
    • 3-column view.
    • 4-column view.
  • Interval Updates: Configure the time interval for fetching new data for graphs (e.g., every 1 minute, 5 minutes, etc.).
  • Period Filters: Apply time-based filters to control the data displayed in the graphs (e.g., Last 24 hours,Last 7 days, etc.)

Reordering Widgets

Widgets can be rearranged using the drag-and-drop interface:

  • Click and hold a widget.
  • Drag it to the desired position.
  • Drop the widget in place to reorder it.

Benefits of Metrics Visualization

  • Comprehensive Monitoring: Gain a holistic view of server performance and integration data.
  • Proactive Management: Identify potential issues early by monitoring critical metrics.
  • Informed Decision-Making: Use data-driven insights to guide infrastructure and resource management.
Last Updated: 7/27/26, 4:34 PM