Xitoring Document
Home
FAQ
Support
Register
Home
FAQ
Support
Register
  • Xitoring

    • Introduction
    • Release Notes
    • Xitoring Release Notes
    • Linux Xitogent Release Notes
    • Windows Xitogent Release Notes
    • Xitoring Mobile App Release Notes
    • Account Management
    • API Access & Automation
    • Team Management & Collaboration
    • Billing & Subscription Management
  • Getting Started

    • Getting Started with Xitoring
    • Workflows & Guides
    • Monitor Your First Server
    • Import / Migration
    • Migrate from UptimeRobot to Xitoring
    • Migrate from Pingdom to Xitoring
    • Migrate from Uptime.com to Xitoring
    • Migrate from BetterStack to Xitoring
  • Help & Support

    • FAQ & Troubleshooting
    • Glossary
  • Server Monitoring

    • Server Monitoring
    • Graphs
    • Live Statistics
    • Monitor Services
    • Auto-Triggers
  • Xitogent on Linux

    • Install Xitogent on Linux
    • Update Xitogent on Linux
    • Uninstall Xitogent on Linux
  • Xitogent on Windows

    • Install Xitogent on Windows
    • Uninstall Xitogent on Windows
    • Xitogent Service
    • Update Xitogent on Windows
    • Disk Performance (I/O)
  • Xitogent on Azure

    • Xitogent on Azure
    • Monitor Azure Linux VM
    • Monitor Azure Windows VM
  • Xitogent CLI

    • Xitogent CLI
    • Xitogent Pause/Unpause
    • Xitogent Status
    • Xitogent debug
    • Xitogent Diagnosis
    • Which data we collect
  • Xitoring CLI

    • Xitoring CLI
  • Uptime Monitoring

    • What is Uptime Monitoring
    • Monitoring Nodes (Geographic Locations)
    • What is Check
    • Auto-Discovery
    • Auto Fault Tolerance
    • Heartbeat Check
    • Ping Check
    • HTTP(S) Check
    • DNS Check
    • FTP Check
    • SMTP Check
    • IMAP Check
    • POP3 Check
    • TCP Check
    • UDP Check
  • SSL Monitoring

    • SSL Monitoring
  • Incidents

    • Incidents
    • Incident's Root Cause
    • Incidents Notification
    • Incident Notes
    • Resolving Incidents Manually
    • Incident Policy
  • Maintenance Schedule

    • Maintenance Schedule
  • Email Reports

    • Email Reports
  • Integrations

    • Integrations
    • Apache Integration
    • CoreDNS Integration
    • CouchDB Integration
    • Disk Health Integration
    • Docker Integration
    • Dovecot Integration
    • Exim Integration
    • HAProxy Integration
    • IIS Integration
    • InfluxDB Integration
    • Kafka Integration
    • KeyDB Integration
    • LiteSpeed Integration
    • MongoDB Integration
    • MySQL Integration
    • Netstat Integration
    • Nginx Integration
    • OpenLiteSpeed Integration
    • OpenVPN Integration
    • PHP-FPM Integration
    • Postfix Integration
    • PostgreSQL Integration
    • RabbitMQ integration
    • Redis Integration
    • MS SQL Server Integration
    • Supervisor Integration
    • Varnish Integration
    • Wireguard Integration
  • Notifications

    • Notifications
    • Creating Notification Roles
    • Email Integration
    • Mobile Push Notifications
    • SMS Integration
    • Phone call Integration
    • Webhook Integration
    • Integration for Slack
    • Telegram Integration
    • WhatsApp Integration
    • Mattermost Integration
    • Discord Integration
    • Google Chat Integration
    • Microsoft Teams Integration
    • Atlassian Opsgenie Integration
    • Splunk On-Call Integration
    • Pushover Integration
    • Pushbullet Integration
    • Gotify Integration
    • Ntfy Integration
    • Spike.sh Integration
    • PagerDuty Integration
    • Zapier Integration
    • AlertOps Integration
  • Status Page

    • Status page
  • 3rd Party Status Pages

    • Using 3rd party Status Pages
    • Atlassian Status Page Integration with Xitoring
    • Status.io Integration with Xitoring
    • Statuspal Integration with Xitoring
    • Instatus Integration with Xitoring
  • Dashboards

    • Main Dashboard
    • Custom Dashboards
  • Metrics

    • Metrics
  • MCP Server

    • Setup & Tool Reference

What is Uptime Monitoring

It is always a pain to see your website not reachable and it is more painful to lose customers because of this issue happening a lot and you are not aware of it. Xitoring will monitor your servers and IP addresses and will let you know if something is wrong with them. Our resolution and interval is less than one minute for all checks and all plans.

For a feature overview and the check limits included on each plan, see the Uptime Monitoring product page and Pricing.

Uptime Overview

Uptime Page is where you can see an overview of all your Server Checks and Checks, you can see reports for their status in different periods using filters, for example at the top of the page, you can filter the results just for your checks, servers or all of your Uptime Monitoring Checks. Also, you have an advanced filter that you can use to set the period to Today and you will see the status for every hour of that day for your Checks if an incident happened in a certain hour the cube for that day will have the red color and if you hover your mouse on that cube you will see a brief report of that incident.
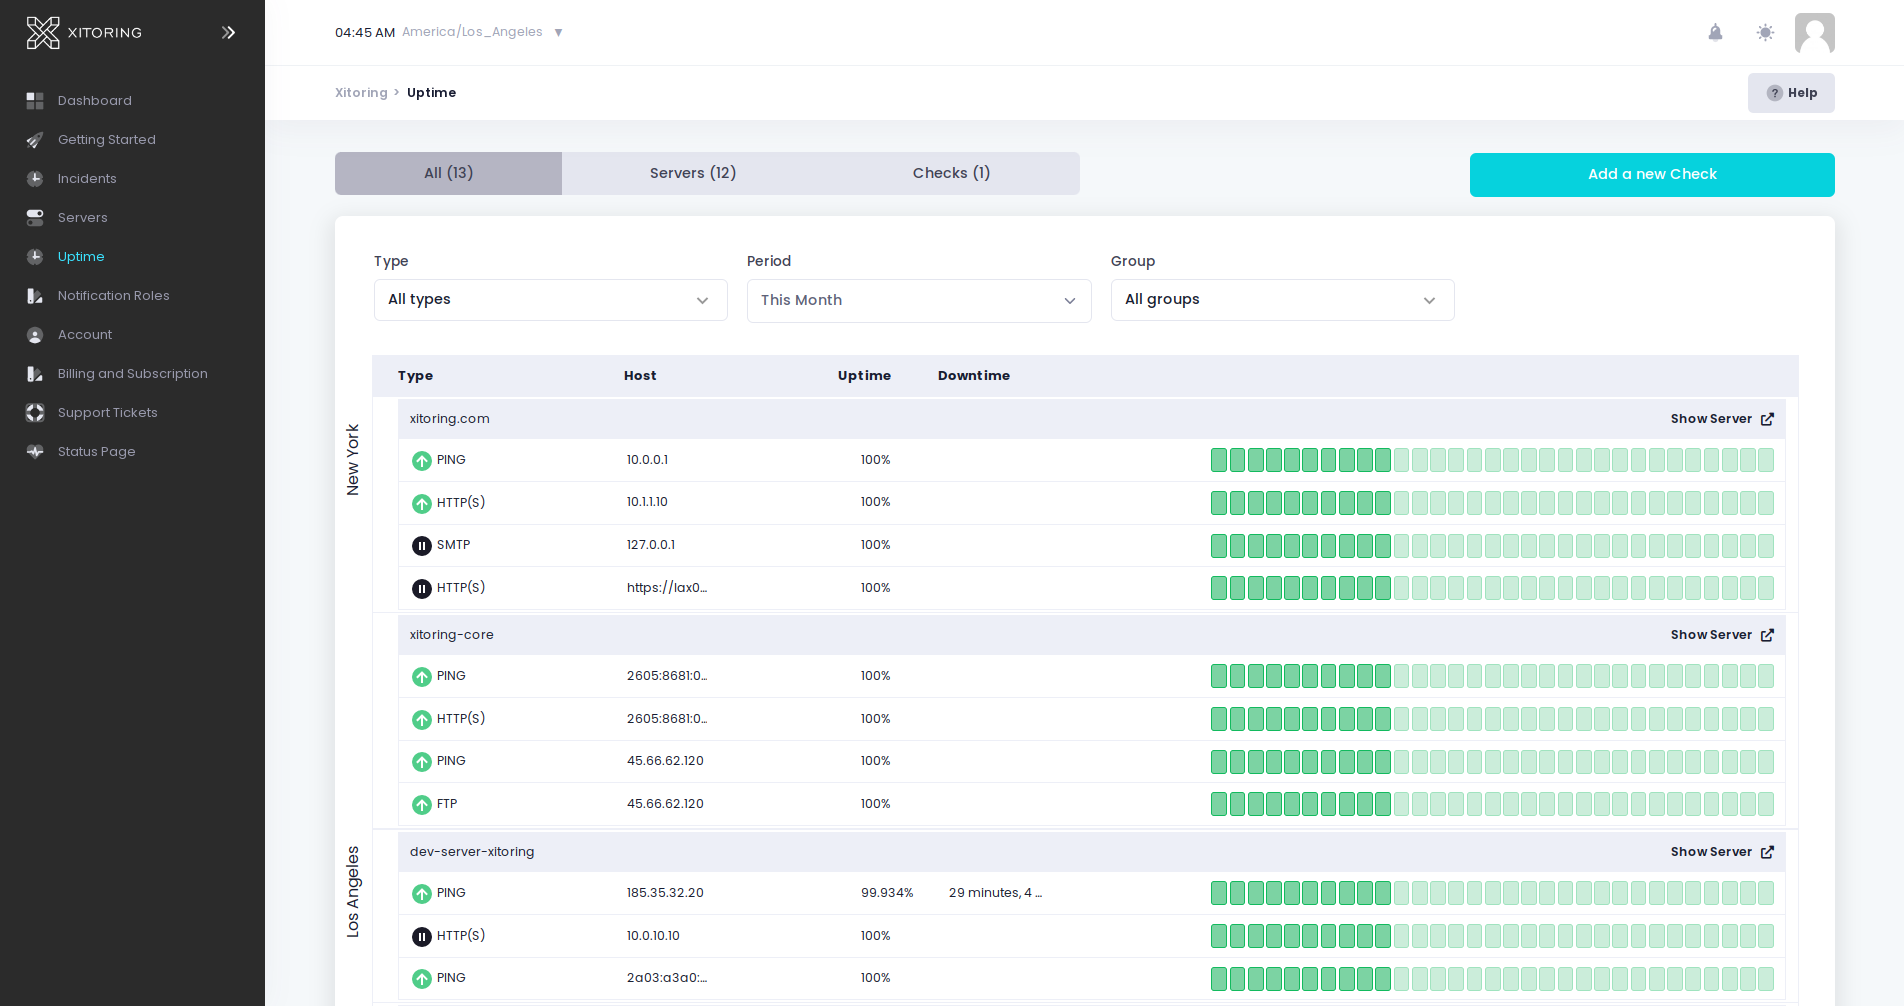
Uptime Overview page
Last Updated: 7/27/26, 5:07 PM
Next
Monitoring Nodes (Geographic Locations)