Graphs
Graphs are one of the most useful and common ways of presenting data and information, in Xitoring we use them to present metric data based on different periods. which can be useful to understand how the resources of your server are being used, is it enough for what is running on it? does it need an upgrade? what should be upgraded? you can find an answer to all these questions and more.
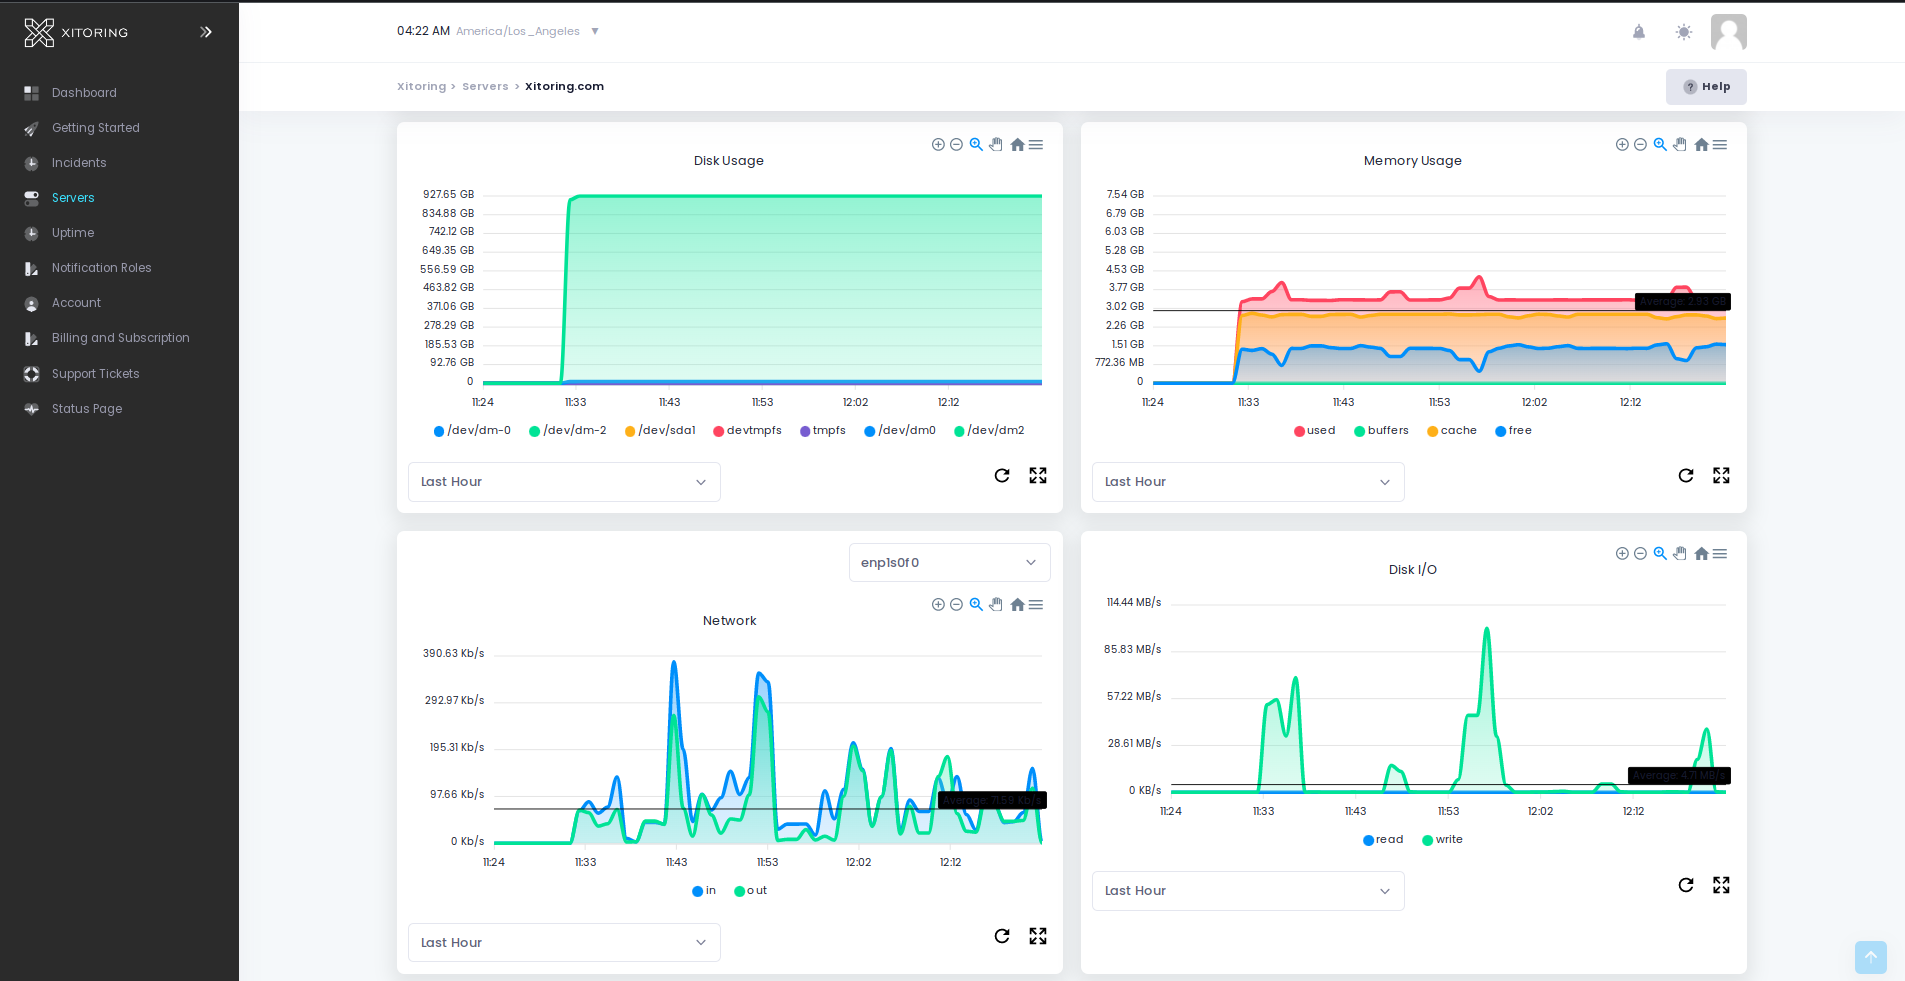
In Xitoring you have different graphs for different statistics, CPU Usage, Load Average, Disk Usage, Memory Usage, Network, Network Packet, Network Dropped, Disk I/O, Ping You can access graphs through Server Overview > Statistics
Tips
If you have integrations enabled, you will see graphs on Server Overview -> Integrations